 QuickPLS
Does responsibility become useful through the way a business manages it?
A commitment to responsible business may be easier to sustain when managers translate it into objectives, monitoring and organisational learning. A mediation question asks whether those management practices connect responsibility with resilience. The practices may also form a broader control system rather than act as interchangeable questionnaire items.
Latif and colleagues studied 121 large manufacturing firms in Punjab using PLS modelling with higher-order constructs. They examined sustainability control systems between CSR and organisational resilience, with additional governance and segmentation analyses. This lesson uses one original higher-order mediator to teach that central pathway. It does not reproduce the paper's governance moderation, segmentation or complete measurement structure.
Put a higher-order mediator between two ordinary constructs
Use 230 fictional manufacturing businesses. RESPONS measures responsible-business commitment through three reflective indicators. RESIL measures organisational resilience through another three. Three lower-order dimensions, GOALS, MONITOR and LEARN, each have three reflective indicators and jointly form CONTROL.
The planned model is RESPONS → CONTROL → RESIL, with RESPONS → RESIL retained. Goals, monitoring and learning form the control system in this teaching definition. A business can be strong in one dimension and weak in another, so the dimensions are not assumed to be interchangeable manifestations.
One row is one business. The indicators are invented continuous 1–7 assessments, not reports from the source firms or validated scale items. The source study used more extensive higher-order measures; this focused adaptation makes only CONTROL higher-order.
The direct path matters because responsibility may have relationships with resilience outside the selected control-system route. Retaining it lets you distinguish the specific indirect association from the remaining direct association under this model.

On a small screen, swipe the table sideways to see every column.
| Columns | Meaning | Role |
|---|---|---|
| RESPONS1–RESPONS3 | Responsible-business commitment | Reflective predictor |
| GOALS1–GOALS3 | Sustainability objectives | Reflective control-system dimension |
| MONITOR1–MONITOR3 | Monitoring routines | Reflective control-system dimension |
| LEARN1–LEARN3 | Learning and revision routines | Reflective control-system dimension |
| RESIL1–RESIL3 | Organisational resilience | Reflective outcome |
| CONTROL | Formed from GOALS, MONITOR and LEARN | Higher-order mediator |
Step 1. Create the ordinary measurement blocks first
The meaning of LEARN here is organisational review of sustainability practice, not a general personal learning trait. Use the codebook to keep it distinct from resilience itself. In a real questionnaire, overlapping wording can make the mediator and outcome appear related partly because they ask the same thing.
Import and check
Choose File > Import Data… in a writable project, then Choose data file…. In Review & import confirm raw data, Header row 1, comma separator, Decimal convention Dot (1.25) and Continuous indicators. Choose Import dataset and confirm Dataset imported and verified.
Start a model
Choose File > New Model…, enter a useful Name, select the imported Dataset version and Cases, then Create model.
Create five reflective blocks
In Indicators select each matching three-column block and Create construct. Name RESPONS, GOALS, MONITOR, LEARN and RESIL through Properties > Model > Name. Set Parameter > Measurement model to Reflective.
Check the assignments
Keep case_id out of the model and ensure no item is assigned twice. The file is complete and positively coded; no reversal is required. Save before adding the higher-order mediator.
Step 2. Form CONTROL and retain both direct and indirect routes
In the result, confirm that GOALS, MONITOR and LEARN form CONTROL, while RESPONS and RESIL remain ordinary reflective blocks. Read HTMT+ for the reflective blocks and dimension weights for CONTROL; the broader formative construct needs a different assessment.
Create the higher-order construct
Select GOALS, MONITOR and LEARN together. Open Higher-Order Construct from Model or the selection context menu. Name it CONTROL and choose Dimensions form the HOC.
Inspect the eligible approach
Review the derived type and recommended approach. Open Advanced, choose Disjoint two-stage under Construction approach, then Create. If Initial model path appears for a protected project revision, select the intended path before Create. A fresh model need not show that field. Check how dimension scores enter the later stage.
Draw the mediation paths
Use Connect for RESPONS → CONTROL, CONTROL → RESIL and RESPONS → RESIL. Inspect the stage mapping so that generated estimation paths are not mistaken for extra research hypotheses.
Estimate the model
Choose Calculate… and the supported PLS-SEM Algorithm setup. Review the selected higher-order approach and readiness, then Start calculation and open the completed result.
Read both measurement levels
Inspect the reflective dimension loadings, reliability, AVE and HTMT+, then CONTROL's weights and collinearity. Only then read the three structural relationships.
Step 3. Check the two stages with this practice file
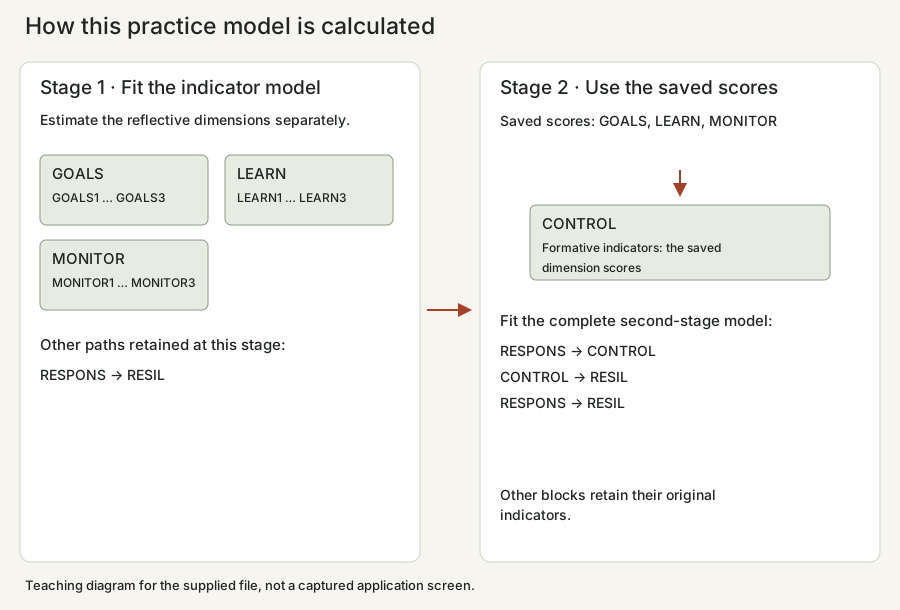
The Disjoint two-stage model first estimates the reflective scores for GOALS, MONITOR and LEARN without CONTROL. Those dimensions have no remaining structural arrows in the first stage. Their scores then form CONTROL in the second stage, while the other constructs keep their original indicators. The stage plan below explains this calculation; create the higher-order construct through the model workflow above.
RESPONS → CONTROL is 0.619 and CONTROL → RESIL is 0.446. The direct RESPONS → RESIL estimate is 0.125 and its interval includes zero. Multiplying the first two estimates gives the indirect point effect, but its uncertainty must come from the paired products within each resample, not from multiplying interval endpoints.
The uncertainty column comes from 1,000 usable full-stage reference refits out of 1,000 requested, with R seed 71013. Both stages are rebuilt in every whole-row resample. The endpoints are the 2.5th and 97.5th percentiles.
About these answers: Separate two-stage reference calculation. Component scores and point estimates were compared with QuickPLS calculation code; this was not a new run through the desktop app.
On a small screen, swipe the table sideways to see every column.
| Second-stage path | Point estimate | 95% reference percentile interval |
|---|---|---|
| RESPONS → CONTROL | 0.619 | 0.549 to 0.692 |
| CONTROL → RESIL | 0.446 | 0.314 to 0.585 |
| RESPONS → RESIL | 0.125 | -0.015 to 0.255 |
How the reference answer was calculated
The reference calculated the second stage separately. Its component scores, point paths and R² values were compared with QuickPLS calculation code. This did not run the app's complete higher-order workflow, so it is not an end-to-end check of that workflow. The interval arithmetic was checked against all 1,000 saved full-stage repetitions. Those repetitions were not independently rerun and are not results from the QuickPLS bootstrap command.
Path weighting, +1 starting weights, 3,000 iterations and stopping criterion 0.0000001. For the isolated reflective dimensions, the reference uses the principal-component limit of the own-score iteration, oriented toward the positive item sum.
These reference intervals are not a run of the app’s native bootstrap command. The download retains the sampled row numbers, settings, reference estimates and any failures.
Step 4. Follow the two calculation stages
Use this plan alongside the model diagram. It shows which scores and paths belong to each stage, so an indicator model and a second-stage score model are not confused.
Step 5. Read the dimensions that form the broader concept
A weight describes a dimension’s contribution while the other dimensions remain in the composite. It is not the same quantity as a reflective indicator loading. Keep a theoretically necessary dimension even when its weight needs further investigation.
On a small screen, swipe the table sideways to see every column.
| Dimension | Formative weight | 95% reference percentile interval |
|---|---|---|
| GOALS | 0.432 | 0.286 to 0.581 |
| LEARN | 0.558 | 0.422 to 0.670 |
| MONITOR | 0.552 | 0.421 to 0.666 |
Step 6. Keep the indirect route together in every resample
RESPONS → CONTROL → RESIL is 0.276, with a reference percentile interval of 0.189 to 0.374. Each sampled-row fit supplies both coefficients before they are multiplied. This calculation describes an indirect association; the cross-sectional teaching design does not establish a causal sequence.
Step 7. A management system is not validated by one high reliability value
In Results use Search result outputs to find Higher-order component relationships, Higher-order structural paths and Higher-order method and run details. The component table separates Loading from Weight. The details table identifies the higher-order construct, components, method and generated measurement; use it to check the specification behind the estimates.
Reflective reliability addresses the coherence of each three-item dimension. It does not establish that goals, monitoring and learning cover every important part of a sustainability control system. That broader content judgement needs theory and domain knowledge.
Read the higher-order weights as conditional contributions to CONTROL under the selected model. Monitoring can have a modest weight because its score overlaps with goals or learning. That does not mean a business can dispense with monitoring.
Inspect separation between LEARN and RESIL especially carefully. Learning routines describe what managers do; resilience describes the business's ability to respond and recover. If their indicators use nearly identical claims about adaptation, the proposed mediation can partly reflect measurement overlap.
Read the structural path together with inner collinearity and outcome variation. A well-fitting synthetic relationship does not prove that implementing a control system would create resilience in actual manufacturers.
On a small screen, swipe the table sideways to see every column.
| Output | Question | Boundary |
|---|---|---|
| Dimension loadings and reliability | Are each dimension's indicators coherent? | Does not establish complete system content |
| HTMT+ | Are routines distinct from resilience? | A low statistic cannot replace item-content review |
| CONTROL weights | How do the dimensions contribute conditionally? | Not a recommendation to remove a small-weight practice |
| Stage mapping | Which dimension scores enter CONTROL? | Scores depend on the chosen estimation stages |
| Specific indirect effect | Does the fitted association pass through CONTROL? | Does not establish the temporal mechanism |
Step 8. Carry the stage uncertainty into the indirect effect
Select full-model higher-order bootstrapping
Choose the supported PLS-SEM Bootstrapping calculation for the saved model. Confirm that the selected higher-order approach and original-case preparation match the point estimate.
Set the teaching plan
Use Bootstrap samples 5000, Confidence level (%) 95 and Seed 71013 where these controls are shown. Review the actual interval method and Start calculation.
Inspect the refits
After completion read attempted, usable and failed counts and availability for the higher-order effects. The required stages must be refitted, not treated as fixed scores estimated once.
Read the whole indirect route
Locate RESPONS → CONTROL → RESIL with its own interval. Read the direct and total effects from the same full-model result. Keep higher-order weight intervals separate from the indirect-effect interval.
An uncertain indirect route can coexist with a clear first path
Hypothetical example
Illustrative reading example
Suppose illustrative RESPONS → CONTROL is 0.60 and CONTROL → RESIL is 0.25. The indirect point estimate is 0.15. Suppose its interval is [−0.01, 0.32]. The strong first relationship does not make the entire indirect route certain.
If the illustrative direct path is 0.10, the total point estimate is 0.25 in the linear model. Do not divide 0.15 by 0.25 and declare that exactly 60% of a causal effect is explained without checking the estimand, uncertainty and causal assumptions. The simple ratio of estimates can be unstable, especially when the total is small.
Suppose LEARN's weight interval also crosses zero. That is a different uncertainty: the separate contribution of one dimension to CONTROL. It does not automatically explain or invalidate the indirect interval. Read both quantities and their measurement context.
An appropriate conclusion would describe a positive indirect estimate with an interval that includes zero, then discuss what better timing, measurement or sample information would help resolve the uncertainty.
0.60 × 0.25 = 0.15, and 0.15 + 0.10 = 0.25. The hypothetical interval [−0.01, 0.32] is an illustration, not an answer for the downloaded data or a source-paper result.
Distinguish a narrower system from a different estimation approach
An eligible approach comparison preserves the dimensions and asks how stage construction affects the estimates. Removing LEARN creates a narrower definition of the control system. Those are different kinds of sensitivity and should not be described interchangeably.
Keep the three-dimension model as planned. If a real indicator is demonstrably miscoded, correct it and refit all affected stages. If a dimension appears redundant, examine content and theory before proposing a separate exploratory model.
The lesson does not infer hidden segments or governance moderation. Adding such analyses would require new questions, compatible settings and enough information to interpret groups or interactions. A paper's long methods list is not a reason to run every available calculation on the practice file.
Check whether the problem belongs to measurement or mediation
On a small screen, swipe the table sideways to see every column.
| Symptom | Check | Action |
|---|---|---|
| CONTROL is treated as a raw questionnaire column | Its dimension definition | Create the higher-order mediator from the three selected blocks. |
| LEARN and RESIL look almost identical | Item content and HTMT+ | Review conceptual overlap before interpreting the indirect route. |
| A small weight prompts automatic dimension removal | The formative definition and collinearity | Keep content coverage and report uncertain contribution. |
| The first path is clear but indirect uncertainty is wide | The whole-product interval | Report the indirect route's own evidence. |
| A bootstrap used fixed dimension scores | The full-model higher-order refit | Use the supported staged bootstrap from original cases. |
| The report claims an exact mediated percentage | Total-effect uncertainty and causal assumptions | Prefer direct, indirect and total estimates with their intervals. |
Step 9. Report the control-system definition and the indirect association
For Results, report dimension measurement, higher-order weights and collinearity first. Then insert the specific indirect, direct and total estimates with matching intervals. Explain any measurement overlap or uncertainty without claiming that a fitted pathway establishes implementation effects.
| Evidence | What to insert |
|---|---|
| Control-system definition | Dimensions, roles and approach |
| Measurement | Lower-order quality, separation and weights |
| Indirect association | RESPONS → CONTROL → RESIL and interval |
| Direct and total | Matching estimates and intervals |
| Sensitivity | Approach or justified definition changes, clearly distinguished |
Methods writing outline
We specified CONTROL as a formative higher-order mediator formed by GOALS, MONITOR and LEARN, each reflectively measured. RESPONS and RESIL were ordinary reflective constructs. We used [staged approach], retained the direct RESPONS → RESIL path and estimated uncertainty by [full-model bootstrap settings and counts].
Step 10. Explain what this staged model actually tested
The indirect RESPONS → CONTROL → RESIL estimate is 0.276, with a reference percentile interval from 0.189 to 0.374. The remaining direct association is 0.125, with an interval from −0.015 to 0.255. Report those results separately, alongside the two stages, measurement roles and score scaling. These reference intervals refit both stages; they are not the app’s native bootstrap output and do not establish a causal sequence.
Explain what is being mediated
- Name the three dimensions of CONTROL.
- Explain why CONTROL is formative while its dimensions are reflective.
- Check separation of learning routines and resilience.
- Find the whole indirect-effect interval.
- Distinguish stage uncertainty from fixed-score analysis.
- Keep the focused lesson separate from the source's additional governance and segmentation analyses.