 QuickPLS
Method reference / European Business Review
When to use and how to report the results of PLS-SEM
Authors and publication: Hair, J. F., Risher, J. J., Sarstedt, M., & Ringle, C. M. (2019). European Business Review, 31(1), 2–24.
Read the original paper DOI: 10.1108/EBR-11-2018-0203. The supplied practice data are a separate teaching example.A model diagram is a useful start, but a paper needs an explanation of what was measured and what the results support. Hair and colleagues describe how to choose, assess and report PLS-SEM. This exercise puts that sequence into practice: build the model, check the measures, read the paths and report uncertainty. The customer data were created for this lesson and do not reproduce a study from the paper.
View the method overview
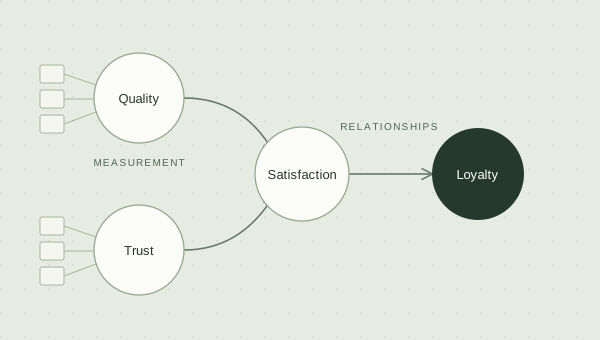
Write the question before drawing the arrows
Ask how Quality and Trust relate to Satisfaction, and how Satisfaction relates to Loyalty. Each concept has three indicators. Treat them as reflective in this exercise: the indicators are expressions of the concept they measure. For your own study, explain why that measurement choice fits the meaning of the questions; selecting a software default is not that explanation.
Import and check the 240 cases
Download customer-experience.csv. Choose File → New Project… (Ctrl+N), enter Customer experience in Project name and use Browse… beside Project file to choose a save location. Click Create project.
Choose File → Import Data… (Ctrl+I), then Choose data file…. Select the CSV. In Review & import, check Header row 1, comma separator and Decimal convention Dot (1.25). Treat the twelve measurement columns as Continuous. Click Import dataset and confirm 240 cases.
Keep case_id out of the model. Use quality_1 to quality_3 for Quality, trust_1 to trust_3 for Trust, satisfaction_1 to satisfaction_3 for Satisfaction, and loyalty_1 to loyalty_3 for Loyalty. These continuous practice scores are not answers from a validated questionnaire.
Create the constructs and connect the model
Choose File → New Model…. Enter Customer experience, select the imported customer-experience Dataset version and confirm Cases shows 240. Click Create model.
In Indicators, select quality_1, quality_2 and quality_3 while holding Ctrl. Confirm 3 selected and click Create construct. Choose Select and click its body. Open View → Show Properties if needed. Under Properties → Model, enter Quality in Name and press Enter. Under Properties → Parameter, set Measurement model to Reflective. Repeat for the other three indicator blocks.
Choose Connect. Drag from Quality to Satisfaction, Trust to Satisfaction, and Satisfaction to Loyalty. Return to Select. Check the four constructs, twelve indicators and three arrows, then save with Ctrl+S.
Open Calculate… and choose PLS-SEM Algorithm. Use Starting weights Standard (+1) and Missing data treatment Casewise deletion. Review Readiness, leave Open Results when finished selected and click Start calculation. Confirm the completed result uses all 240 cases.
The picture shows estimates on the separate Corporate Reputation sample model. For this exercise, build Quality, Trust, Satisfaction and Loyalty with the three arrows described above.

Check what the indicators measure
In Results, read Estimates → Outer loadings, then the reliability and validity tables. A loading describes how closely an indicator relates to its construct. Reliability concerns consistency among the measures; convergent validity concerns how well they reflect their intended concept. HTMT helps assess whether the constructs are distinct. If an item looks weak, check its wording, coding and meaning before considering its removal.
Read the paths and then their uncertainty
Open Effects → Direct effects for the three relationships, and Estimates → R-squared for explained variance. Compare these fitted values with the checked answers below.
For the same model, choose Calculate → PLS-SEM Bootstrapping. For this teaching run, enter 1,000 Bootstrap samples, Confidence level (%) 95 and Seed 20261105. Leave Open Results when finished selected and click Start calculation. Record the resulting interval definition and the requested, usable and failed sample counts. This lesson supplies checked point estimates, not checked answers for the bootstrap run.
Read each path estimate with its own interval. The interval describes uncertainty around that estimate; the point estimate alone cannot tell you whether its interval excludes zero.
Write the findings and keep the analysis
Start the results section with the measurement checks, then describe each planned relationship using its estimate and actual interval. Include findings that do not support your expectation.
Save with File → Save (Ctrl+S). With the completed result selected, choose File → Save Report…. Enter a Saved report name, check Result source and click Save report. Reopen the project with File → Open Project… and check that the saved report refers to the intended model, dataset and calculation.
To assess prediction for new cases, use a separate prediction analysis. R-squared describes the fitted sample, not a held-out prediction test.
Settings and answer check
Check your first PLS result
Use these choices for a first run, then compare the path estimates and explained variance below. The answer pack also contains the indicator loadings and weights.
Use this setup first
- Use all 240 cases. Keep case_id out of the model. Make Quality, Trust, Satisfaction and Loyalty reflective, with their three named indicators each.
- Draw Quality → Satisfaction, Trust → Satisfaction and Satisfaction → Loyalty. Use ordinary PLS-SEM. The checked calculation used path weighting and standardised data.
- Under Missing data, set Treatment to Casewise deletion, called listwise deletion in the calculation record. The checked calculation used a 3,000-iteration limit and a stopping criterion of 0.0000001; these describe how the answer was calculated. Compare point estimates first, then run bootstrapping separately for uncertainty.
| Result | Expected value, rounded |
|---|---|
| Quality → Satisfaction | 0.444622 |
| Trust → Satisfaction | 0.431074 |
| Satisfaction → Loyalty | 0.646988 |
| Satisfaction R² | 0.491364 |
| Loyalty R² | 0.418593 |
What this tells you
The three estimated relationships are positive in this invented dataset. The model explains about 49.1% of the variation in Satisfaction and 41.9% in Loyalty. These figures describe the fitted sample. They do not establish causality, statistical significance or prediction for new cases.
If your answer is different
If your values differ, first check the three arrows, reflective indicator assignments, standardisation and the 240-case count. A different model answers a different question. Do not remove cases or indicators just to force agreement.
All 29 checked path, loading, weight and R² values agreed with cSEM 0.7.1 within the allowed difference stated in the answer pack.
QuickPLS calculations run outside the desktop app and compared with an independent statistical package. See how the answers were checked below.
How these answers were checked
Calculated on 6 November 2026 by running the QuickPLS calculation code from release tag v1.03.11 directly, outside the desktop app. These are point estimates, not results from a new Microsoft Store app walkthrough. Bootstrap intervals and p-values are not part of this answer check. The screenshots in this article show a separate example.
The download includes the exact practice CSVs, unrounded results, model settings and scripts to repeat the reference calculation. It does not contain data from the cited papers or the QuickPLS application.
The point of the exercise
Read the result in context.
The checked model explains about 49.1% of the variation in Satisfaction and 41.9% in Loyalty in this practice sample. All three estimated relationships are positive. Explain their size together with the intervals from your own bootstrap run; the answer table above checks fitted values only. The data were designed for teaching, so their pattern does not establish a theory about real customers or show cause and effect.
Avoid this mistake
Keep measurement quality, relationship estimates and prediction as separate questions. Good reliability alone does not validate the model. Do not remove an item or add an arrow simply to make a probability smaller. Keep the planned analysis and explain any later changes.
Your practice material
240 invented observations with four constructs and three indicators each. The data were generated with seed 20261104 and are available under CC0. No real participants, copied questionnaire items or observations from the paper are included.
About this exercise
The instructions were checked against the app code. The answer table compares results calculated by QuickPLS code outside the desktop app with cSEM. The Microsoft Store app was not run again for this check, and the picture illustrates a separate sample model.