 QuickPLS
A chain of associations needs a careful outcome label
Subramanya, Krishnan and Azad examined relationships among individual entrepreneurial orientation, generative-AI use, dependence and perceived skill atrophy. Their two-wave study analysed 143 knowledge workers and used PLS with bootstrap inference. The outcome was a perception of skill loss, not a direct performance test.
In QuickPLS you will create four reflective constructs, fit all six planned paths and bootstrap the complete serial route. The original synthetic data let you compare that route with the shorter indirect effects and the direct association. This adapts the paper’s serial-mediation question without reproducing its higher-order orientation measure, long-term-orientation moderation or published estimates.
Your study: initiative, use, dependence and perceived loss
Imagine asking whether workers who take initiative tend to use AI more, whether use is associated with greater dependence, and whether dependence is associated with feeling less able to work unaided. The file contains 340 fictional workers. Each construct has three reflective teaching indicators on a complete continuous 1–7 scale.
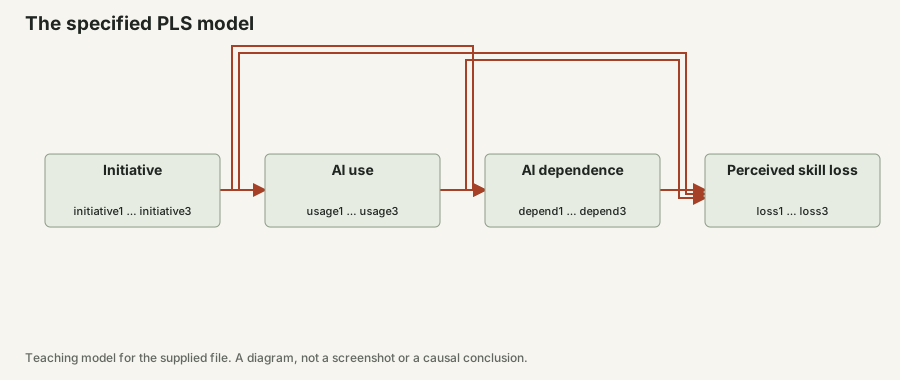
The order Initiative → AI use → AI dependence → Perceived skill loss is the proposed serial pathway. Serial means that the intermediate variables appear in a sequence. It does not mean the data prove that sequence occurred. Treat the teaching file as one observation per invented person, with no actual measurement waves.
Fit the fuller set of paths so the long route is not forced to carry every association: Initiative → AI use; Initiative → AI dependence; AI use → AI dependence; Initiative → Perceived skill loss; AI use → Perceived skill loss; and AI dependence → Perceived skill loss. This allows the long route, two shorter indirect routes and a direct association to be read separately.
On a small screen, swipe the table sideways to see every column.
| Construct | Columns | Role |
|---|---|---|
| Initiative | initiative1, initiative2, initiative3 | Starting predictor |
| AI use | usage1, usage2, usage3 | First mediator |
| AI dependence | depend1, depend2, depend3 | Second mediator |
| Perceived skill loss | loss1, loss2, loss3 | Self-perception outcome |
| Case label | case_id | One fictional worker |
Step 1. Keep use, dependence and performance conceptually separate
Frequent use is not the same as dependence. Someone may use a tool daily while remaining able to work without it. Likewise, feeling less capable is not the same as losing measured skill. Keep those distinctions in the names of the constructs and in every result sentence.
Create a writable project and choose File → Import Data… → Choose data file…. In Review & import check raw data, Header row 1, comma separation and Decimal convention Dot (1.25). Keep the twelve measurement columns Continuous, then choose Import dataset. Confirm Dataset imported and verified with 340 cases.
The file is complete and all indicators point in the stated direction. Keep case_id out of the model. In a real two-wave study, confirm that records were linked to the same people and account for missing follow-ups. Having two waves improves timing information but does not automatically eliminate common causes or selection into continued participation.
Step 2. Draw all six planned paths before calculating
Create the project model
Choose File → New Model…. Name it Initiative and AI dependence, confirm Dataset version and the 340 cases, then choose Create model.
Create four reflective blocks
In Indicators, Ctrl-select initiative1, initiative2 and initiative3, then choose Create construct. Select the block and enter Initiative under Properties → Model → Name. Under Parameter → Measurement model choose Reflective. Repeat with usage1–usage3 for AI use, depend1–depend3 for AI dependence and loss1–loss3 for Perceived skill loss.
What you should see: The four blocks use distinct indicator sets; case_id remains unassigned.
Draw the serial route
Choose Connect and drag Initiative to AI use, AI use to AI dependence, and AI dependence to Perceived skill loss. Check every arrow points forward along the proposed route.
Add the planned shorter paths
Still using Connect, draw Initiative to AI dependence, Initiative to Perceived skill loss, and AI use to Perceived skill loss. Return to Select, check the six arrows and save. Do not add reverse arrows, which would create feedback loops.
Run the original calculation
Choose Calculate… → PLS-SEM Algorithm. Select Starting weights → Standard (+1) and Missing data → Treatment → Casewise deletion. Review Readiness and choose Start calculation. All teaching cases are complete, so this treatment excludes none.
Step 3. Check whether the measures distinguish use from dependence
In the completed result, inspect Estimates → Outer loadings for all four blocks. Read the indicator direction and content rather than only whether a loading clears a threshold. Then open Reliability and validity → Construct reliability and validity for the reflective reliability and average variance extracted results.
Pay particular attention to Discriminant validity → HTMT+ for AI use and AI dependence. If a real dependence instrument merely repeats frequency-of-use questions, the two mediators may not be distinct. A serial diagram cannot create a distinction that the items do not measure.
Open Collinearity and effects → Inner VIF values for each equation. Perceived skill loss has three predictors in this model, while AI use has only Initiative. Read VIF in the correct outcome context. Strong overlap in the loss equation can make separate paths unstable even if each predictor has a sizeable simple association with loss.
Save the measurement assessment before interpreting the long route. If the distinction between use and dependence is weak, any claimed sequence should be reconsidered on conceptual and measurement grounds, not repaired by deleting whichever arrow has an inconvenient probability.
Check the fitted answers for these 340 cases
Use all 340 cases in ai-dependence-serial-mediation.csv and the exact blocks and arrows in this lesson. The check uses ordinary PLS, path weighting, standardised indicators, starting weights +1, a 3,000-iteration limit and stopping criterion 0.0000001. Initiative, AI use, AI dependence and Perceived skill loss are reflective blocks and use Mode A.
The direct initiative → loss estimate is −0.195, while the full initiative → usage → depend → loss product is positive at about 0.090. Loss is perceived performance loss: a higher score is worse, not better performance.
About these answers: Calculated from QuickPLS calculation code and independently checked with the cSEM package in R.
On a small screen, swipe the table sideways to see every column.
| Specified path | Point estimate | Reference 95% percentile interval |
|---|---|---|
| Initiative → AI use | 0.391 | 0.309 to 0.477 |
| Initiative → AI dependence | 0.103 | 0.007 to 0.204 |
| AI use → AI dependence | 0.489 | 0.390 to 0.574 |
| Initiative → Perceived skill loss | -0.195 | -0.303 to -0.089 |
| AI use → Perceived skill loss | 0.097 | -0.025 to 0.212 |
| AI dependence → Perceived skill loss | 0.473 | 0.383 to 0.568 |
How these answers were checked
The checks compared 33 estimates from the original data and 6,000 direct-path estimates from 1,000 repeated fits. Every difference was within the absolute tolerance of 0.00000001. QuickPLS v1.03.11 calculation code and cSEM 0.7.1 used the same model, file and sampled rows. Both calculations returned usable results for all 1,000 fits.
The reference used R seed 202611076 to sample rows and calculated percentile intervals with R quantile type 7. It repeatedly fitted the model through calculation code; it did not use the desktop app’s Bootstrapping command. The same seed can produce different sampled rows in different programs. The download includes the actual row numbers, unrounded answers and settings so this calculation can be repeated.
Check the measurement values and explained variation
Check the measurement values and explained variation
All four blocks in this exercise are reflective. A loading relates an indicator to its construct score; the weights are used to form those scores. The presence of a weight column does not make these formative blocks. Read the loadings alongside reliability, discriminant-validity and item-content checks; high loadings alone do not establish validity or distinct concepts.
About these answers: Estimates from the original data, calculated with QuickPLS code and cSEM using the same model and file.
On a small screen, swipe the table sideways to see every column.
| Block / indicator | Loading | Weight |
|---|---|---|
| Initiative / initiative1 | 0.949 | 0.390 |
| Initiative / initiative2 | 0.950 | 0.356 |
| Initiative / initiative3 | 0.935 | 0.313 |
| AI use / usage1 | 0.942 | 0.347 |
| AI use / usage2 | 0.948 | 0.364 |
| AI use / usage3 | 0.952 | 0.344 |
| AI dependence / depend1 | 0.947 | 0.351 |
| AI dependence / depend2 | 0.951 | 0.360 |
| AI dependence / depend3 | 0.945 | 0.344 |
| Perceived skill loss / loss1 | 0.945 | 0.342 |
| Perceived skill loss / loss2 | 0.947 | 0.354 |
| Perceived skill loss / loss3 | 0.955 | 0.358 |
Explained variation in each outcome
R² describes this fitted sample. It is not a test of prediction on new observations.
| Outcome | R² |
|---|---|
| AI use | 0.153 |
| AI dependence | 0.289 |
| Perceived skill loss | 0.250 |
Read each indirect route separately
Each row follows one specific route. Multiply its component coefficients within each repeated fit before taking the interval; multiplying the endpoints of component intervals is incorrect. These are statistical associations in synthetic data, not evidence of causal mediation.
About these answers: Each indirect effect was recalculated in every saved reference resample. These intervals were not produced by the desktop app’s Bootstrapping command.
On a small screen, swipe the table sideways to see every column.
| Specific route | Point product | Reference 95% percentile interval |
|---|---|---|
| Initiative → AI use → AI dependence | 0.191 | 0.136 to 0.249 |
| Initiative → AI use → AI dependence → Perceived skill loss | 0.090 | 0.061 to 0.128 |
| Initiative → AI use → Perceived skill loss | 0.038 | -0.009 to 0.087 |
| Initiative → AI dependence → Perceived skill loss | 0.049 | 0.003 to 0.103 |
| AI use → AI dependence → Perceived skill loss | 0.231 | 0.170 to 0.300 |
Step 4. Name every route before adding indirect effects
In Effects, find the specific indirect results. The long route is Initiative → AI use → AI dependence → Perceived skill loss. The shorter routes are Initiative → AI use → Perceived skill loss and Initiative → AI dependence → Perceived skill loss. Read the named route on each row; total indirect is their sum under this specified linear model.
The direct Initiative → Perceived skill loss coefficient comes from the loss equation after accounting for both mediators. A total effect combines that direct coefficient with the relevant indirect effects. A small total can hide positive and negative routes that offset each other.
Use full-precision coefficients from the same saved result for a hand calculation. Mixing a first-stage coefficient from a simpler model with a later coefficient from this model changes the calculation. Small differences caused by rounding should be distinguished from differences caused by different paths or cases.
Hypothetical example
Illustrative reading example
Suppose Initiative → AI use is 0.40, AI use → AI dependence is 0.50, and AI dependence → Perceived skill loss is 0.45. The long indirect product is 0.40 × 0.50 × 0.45 = 0.09. If the two shorter indirect products are 0.03 and 0.02, total indirect is 0.14. A direct coefficient of -0.12 gives total 0.02. The small total does not erase the positive long route. These are invented arithmetic values.
Step 5. Calculate uncertainty for the complete route
Return to Calculate… and choose PLS-SEM Bootstrapping for the same six-path model. For a first teaching run set Bootstrap samples to 1000, Confidence level (%) to 95 and Seed to 202611076. Review the selected model and missing-data treatment, then start calculation.
The complete-model bootstrap resamples workers with replacement, refits the measurement and structural model, and recalculates each indirect product. This keeps the dependence among its estimated segments. Multiplying the bounds of three separate intervals does not provide the interval for their product.
Read the original long-route estimate, its named interval and any availability message. Record attempted, usable and failed fits. A route whose interval includes zero is uncertain under that procedure; an unavailable interval means the requested statistic was not obtained. Neither should be described as a proven absence of a mechanism.
Select the bootstrap result for Initiative and AI dependence. Find the complete Initiative → AI use → AI dependence → Perceived skill loss row and read its own interval. Keep the shorter routes and the direct Initiative → Perceived skill loss row beside it when explaining the decomposition.
Hypothetical example
Illustrative reading example
A long-route estimate of 0.09 with a 95% interval of [0.03, 0.17] would support a positive indirect association under the fitted model. It would still not demonstrate that AI caused objective skill deterioration. The outcome label and the study design limit that interpretation.
Use an unexpected result to identify the actual uncertainty
On a small screen, swipe the table sideways to see every column.
| What you notice | Check | What to do |
|---|---|---|
| The total association is close to zero | Direct and specific indirect signs | Report the opposing components before their sum. |
| The long product differs from hand multiplication | Exact path labels, scale and full-precision values | Use coefficients from the same fitted model and cases. |
| AI use and dependence are hard to distinguish | Item meanings, HTMT and predictor overlap | Revisit measurement; do not claim a sequence between near-duplicate concepts. |
| One segment is nonsignificant | The long indirect effect’s own interval | Do not impose a separate significance screen instead of testing the product. |
| The long interval includes zero | Its width and plausible magnitudes | Describe uncertainty rather than declaring the mechanism absent. |
| Many resamples fail | Constant indicators, collinearity and convergence messages | Investigate stability and report the failed counts. |
Check the structural interpretation without searching for a result
A useful comparison asks whether the long-route conclusion changes when theoretically justified shorter paths are included. Preserve the fuller six-path model as the baseline described here. If a simpler model is defensible, save it separately, explain its restrictions and compare the exact same long route. Do not remove shorter paths solely because they reduce its significance.
A more important design check asks whether the measures and timing could distinguish the proposed sequence from alternatives. People already worried about their skills might report greater dependence, or job difficulty could affect both. A real longitudinal or experimental design would need a plan for those possibilities. Adding arrows after the fact does not establish the required time order.
Keep the outcome wording as Perceived skill loss in the tables and discussion. To study actual skill change, a future design would need relevant performance measurements over time. This practice file supplies no such evidence, and its number of synthetic cases is not a recommendation for that future design.
Report the route and the outcome without overstating either
Methods outline: We fitted a reflective PLS model with Initiative, AI use, AI dependence and Perceived skill loss. We specified the serial route and the three additional direct paths listed in the model plan. We assessed measurement distinction and predictor collinearity before reading specific indirect effects. Uncertainty came from [complete-model bootstrap procedure, count, level and seed], with [usable and failed counts].
Results outline: The specific Initiative → AI use → AI dependence → Perceived skill loss association was [estimate], with an interval of [bounds]. The shorter indirect effects were [named estimates and intervals], and the direct association was [estimate and interval]. These results concern reported perceptions and do not establish objective skill loss or a causal sequence.
| Row to report | What to keep with it |
|---|---|
| Long serial route | All four construct names, product and matching interval. |
| Each shorter route | Its own named sequence and interval. |
| Direct and total effects | Correct definitions and signs, kept separate. |
| Measurement distinction | Evidence that use and dependence are different constructs. |
| Analysis counts | Included cases, attempted and usable resamples, failures. |
| Design interpretation | Timing, common causes and the perceived nature of the outcome. |
Put this result into a report
We fitted the specified ordinary PLS model to 340 original synthetic teaching cases. The measurement roles and complete structural model were fixed before interpreting the results. Point estimates were checked against an independent cSEM calculation.
Report the relevant path estimate and its matching interval from the table. If you use these supplied intervals, identify the separate repeated-fit reference calculation. For results from your own app analysis, report that run’s settings and intervals. A real study also needs the actual sampling design, measurement evidence and a reason for each model choice.
Finish when you can explain the whole decomposition
- Point to all six arrows and identify the long route.
- Use the saved full-precision estimates to calculate the long indirect route, the sum of the three Initiative-to-loss indirect routes and the total Initiative-to-loss association. Explain how these differ from the separately labelled hypothetical example.
- Explain why a small total can coexist with meaningful opposing components.
- Find the long-route interval rather than using three separate path tests.
- Write the outcome as perceived skill loss without claiming a measured performance decline.