 QuickPLS
What the method does
PLSpredict estimates a model on training cases and evaluates predictions on held-out cases through cross-validation. CVPAT tests a paired difference in predictive loss. These procedures address predictive performance; explained variance in the training data answers a different question.
RMSE = √[Σᵢ(yᵢ − ŷᵢ)² / n]. Paired loss difference = lossPLS − lossbenchmark.
RMSE is expressed on the outcome scale and gives greater weight to large errors. A negative paired difference favours PLS under this stated subtraction order. Interpret the CVPAT uncertainty using the same cases, outcomes and loss definition.
Data and analysis in QuickPLS
Use a model and numeric case-level data with enough cases for the chosen folds. Keep data preparation within the training procedure to avoid leakage into the test cases.
QuickPLS runs the selected prediction plan and displays indicator errors and benchmark comparisons. Read the repeat and fold settings with the paired results.
Follow a worked example
The following example shows the data, settings and decisions for one analysis. Use the linked practice files to follow it. For your own study, keep the procedure and choose the variables, model and settings that fit your research question.
Download research-workshop.csv to begin. It contains 360 rows and 31 columns. The example below identifies the variables to use, their roles and any rows to exclude; not every column is an analysis variable.
Can your model predict a customer it has not seen?
Imagine that a new customer has answered the Quality and Trust questions. Can the model predict that customer's Satisfaction and Loyalty answers? PLSpredict checks this by hiding some customers from model fitting, predicting their answers, and comparing those predictions with what they actually reported.
The hidden customers are called held-out cases. Cross-validation divides the data into groups, or folds, so each group takes a turn as the test group. The model learns from the other groups. Any means, scales or other data preparation must also be learned from those training cases alone.
Two simple alternatives make the result easier to judge. The indicator-average benchmark (IA) predicts the training group's average answer. The linear-model benchmark (LM) fits a regression using the information allowed for the prediction task. CVPAT, the cross-validated predictive ability test, asks whether the model's prediction errors are lower than a named benchmark's errors for the same cases.
Practise predicting Satisfaction and Loyalty
Use research-workshop.csv to build Quality, Trust, Satisfaction and Loyalty. Assign quality_1, quality_2 and quality_3 to Quality; use the corresponding three trust, satisfaction and loyalty columns for the other constructs. Draw Quality → Satisfaction, Trust → Satisfaction and Satisfaction → Loyalty. Keep group, weight, identifiers and the supplied mean columns outside the model.
These 360 synthetic cases give you a manageable exercise. For the first task, imagine that only Quality and Trust have been measured for a new customer. Predict the Satisfaction and Loyalty indicators from that earlier information.
You will compare the model with a training-sample average and a linear prediction using the same allowed information. The numerical examples below are teaching illustrations, not fitted results from this CSV or a claim about a real customer population.
Decide what you will know when making the prediction
Write down the answers you want to predict and the information you will already have. In the workshop, Quality and Trust are available before Satisfaction and Loyalty. That timing determines which predictors the model may use.
Choose the fold count, repetitions, missing-data treatment and random seed before examining the errors. A seed lets the software repeat its random splitting procedure. Keep the dataset and row order too: the same seed is not enough if the input data change.
Check the original model and indicator coding first. Cross-validation assesses the specified prediction task; it cannot decide whether the questionnaire measures the concepts you intended.
Open prediction and set up the test
For the first workshop task, only Quality and Trust are available for a new case. Select Earliest antecedents and the stated five-fold, two-repetition plan below. A later Direct antecedents run is a different information scenario.
Find the prediction method
With the intended model open, click Calculate…. Type PLSpredict / CVPAT into Find a method and select that row. If the list is collapsed, open Methods first.
Choose the information and split settings
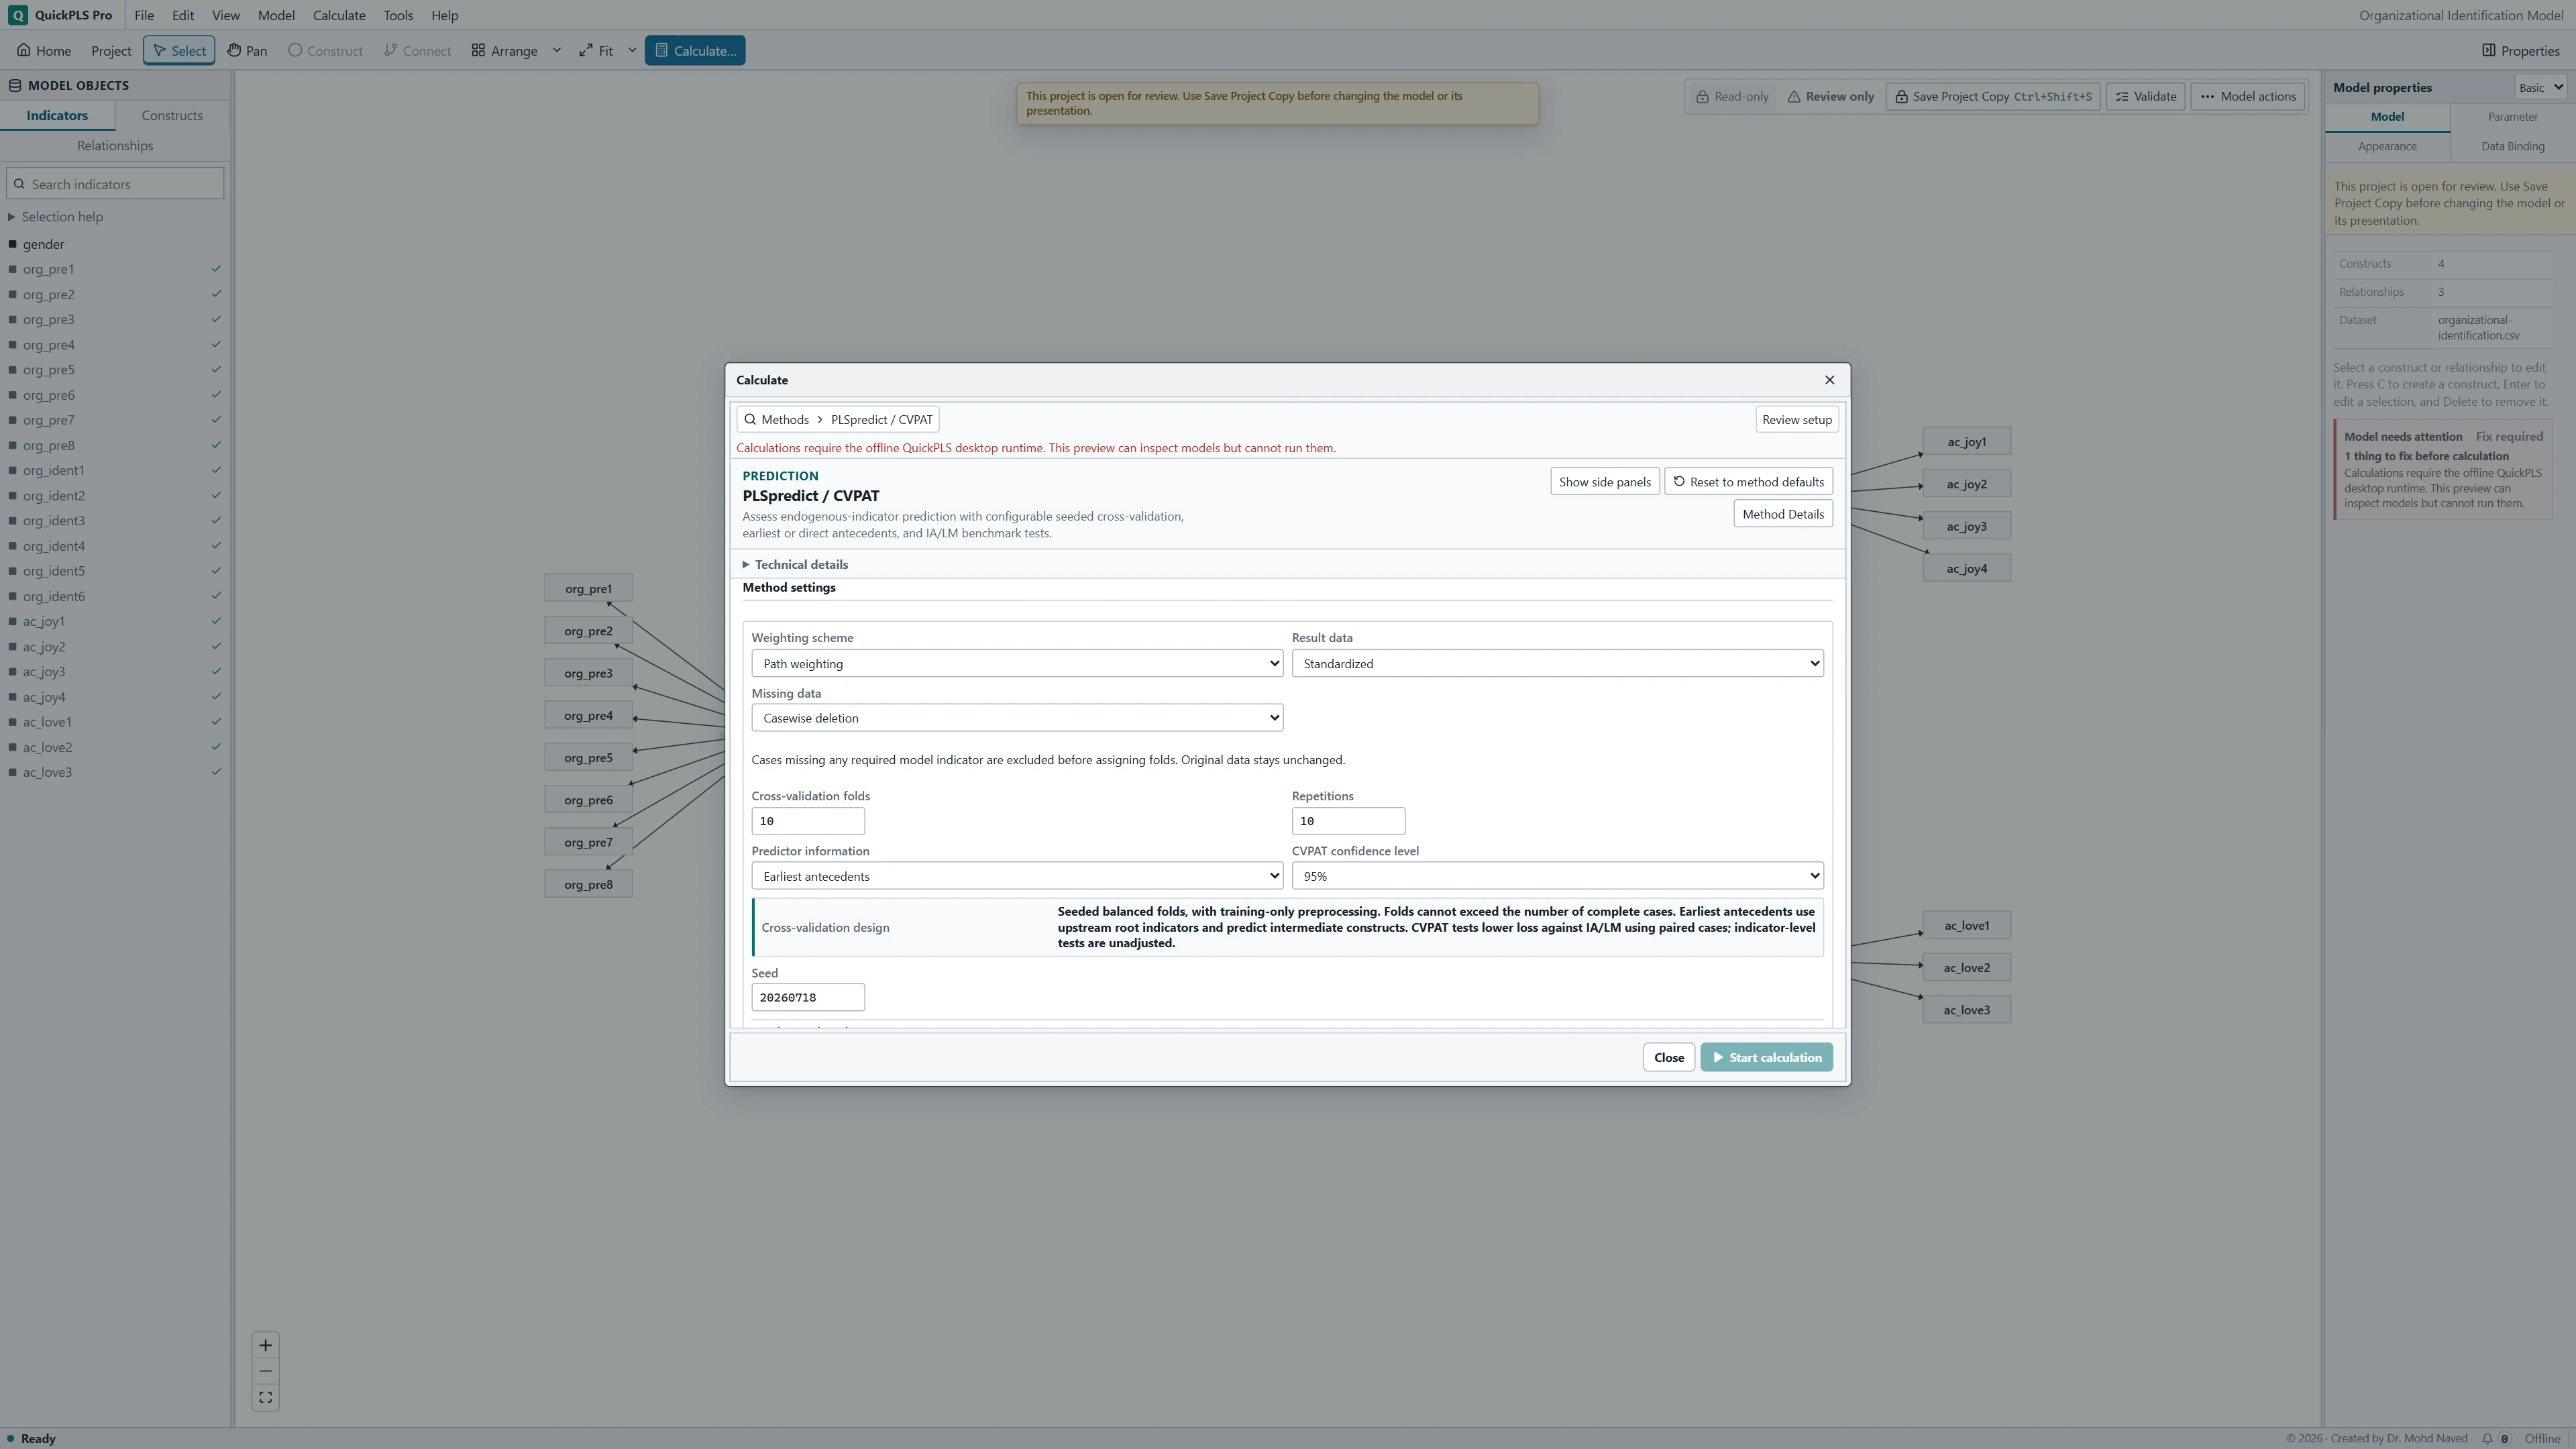
Set Predictor information, Cross-validation folds, Repetitions, CVPAT confidence level and Seed. Check Weighting scheme, Result data and Missing data. The setup computes comparisons with IA and LM; there is no separate benchmark-selection dropdown in this panel.
Run and read the comparisons
Review Readiness, keep Open Results when finished selected, and click Start calculation. In Results, check the selected run in the Result dropdown, then open Model fit for Indicator prediction summary. Open Inference for CVPAT benchmark assessment (single model). Read each benchmark's availability and any warnings before comparing errors.
Run the first prediction task
Write down the information rule
Quality and Trust are known; Satisfaction and Loyalty are not. Choose Earliest antecedents for this task. Antecedents are the constructs that come before an outcome in the model. The calculation must predict the intermediate Satisfaction information instead of taking its held-out answers as known.
What you should see: The prediction task states what is available for a new case.
How to read it: Exclude information that would reveal the target.
Enter the workshop settings
Click Calculate…, find PLSpredict / CVPAT and select it. Set Cross-validation folds to 5, Repetitions to 2, Seed to 20261105, Predictor information to Earliest antecedents and CVPAT confidence level to 95%. These are manageable practice choices, not universal best settings. Keep the intended PLS Weighting scheme and Result data settings recorded.
What you should see: The fold, repeat and benchmark settings match the exercise.
How to read it: Both models must be evaluated on comparable held-out cases.

PLSpredict / CVPAT settings in QuickPLS. Select your own dataset and model, then use the choices described in the steps. Choose the complete-data preparation
Set Missing data → Casewise deletion for this complete file. This keeps only rows with all required model indicators before assigning folds. The separate choices Training-only mean replacement and Pairwise deletion need their own missing-data assessment. Do not fill missing values using the whole file's mean before validation: that would let held-out cases influence training preparation. Review Readiness and click Start calculation.
What you should see: Data preparation uses the intended training procedure.
How to read it: Test-case information must not leak into fitting.
Read the indicator errors
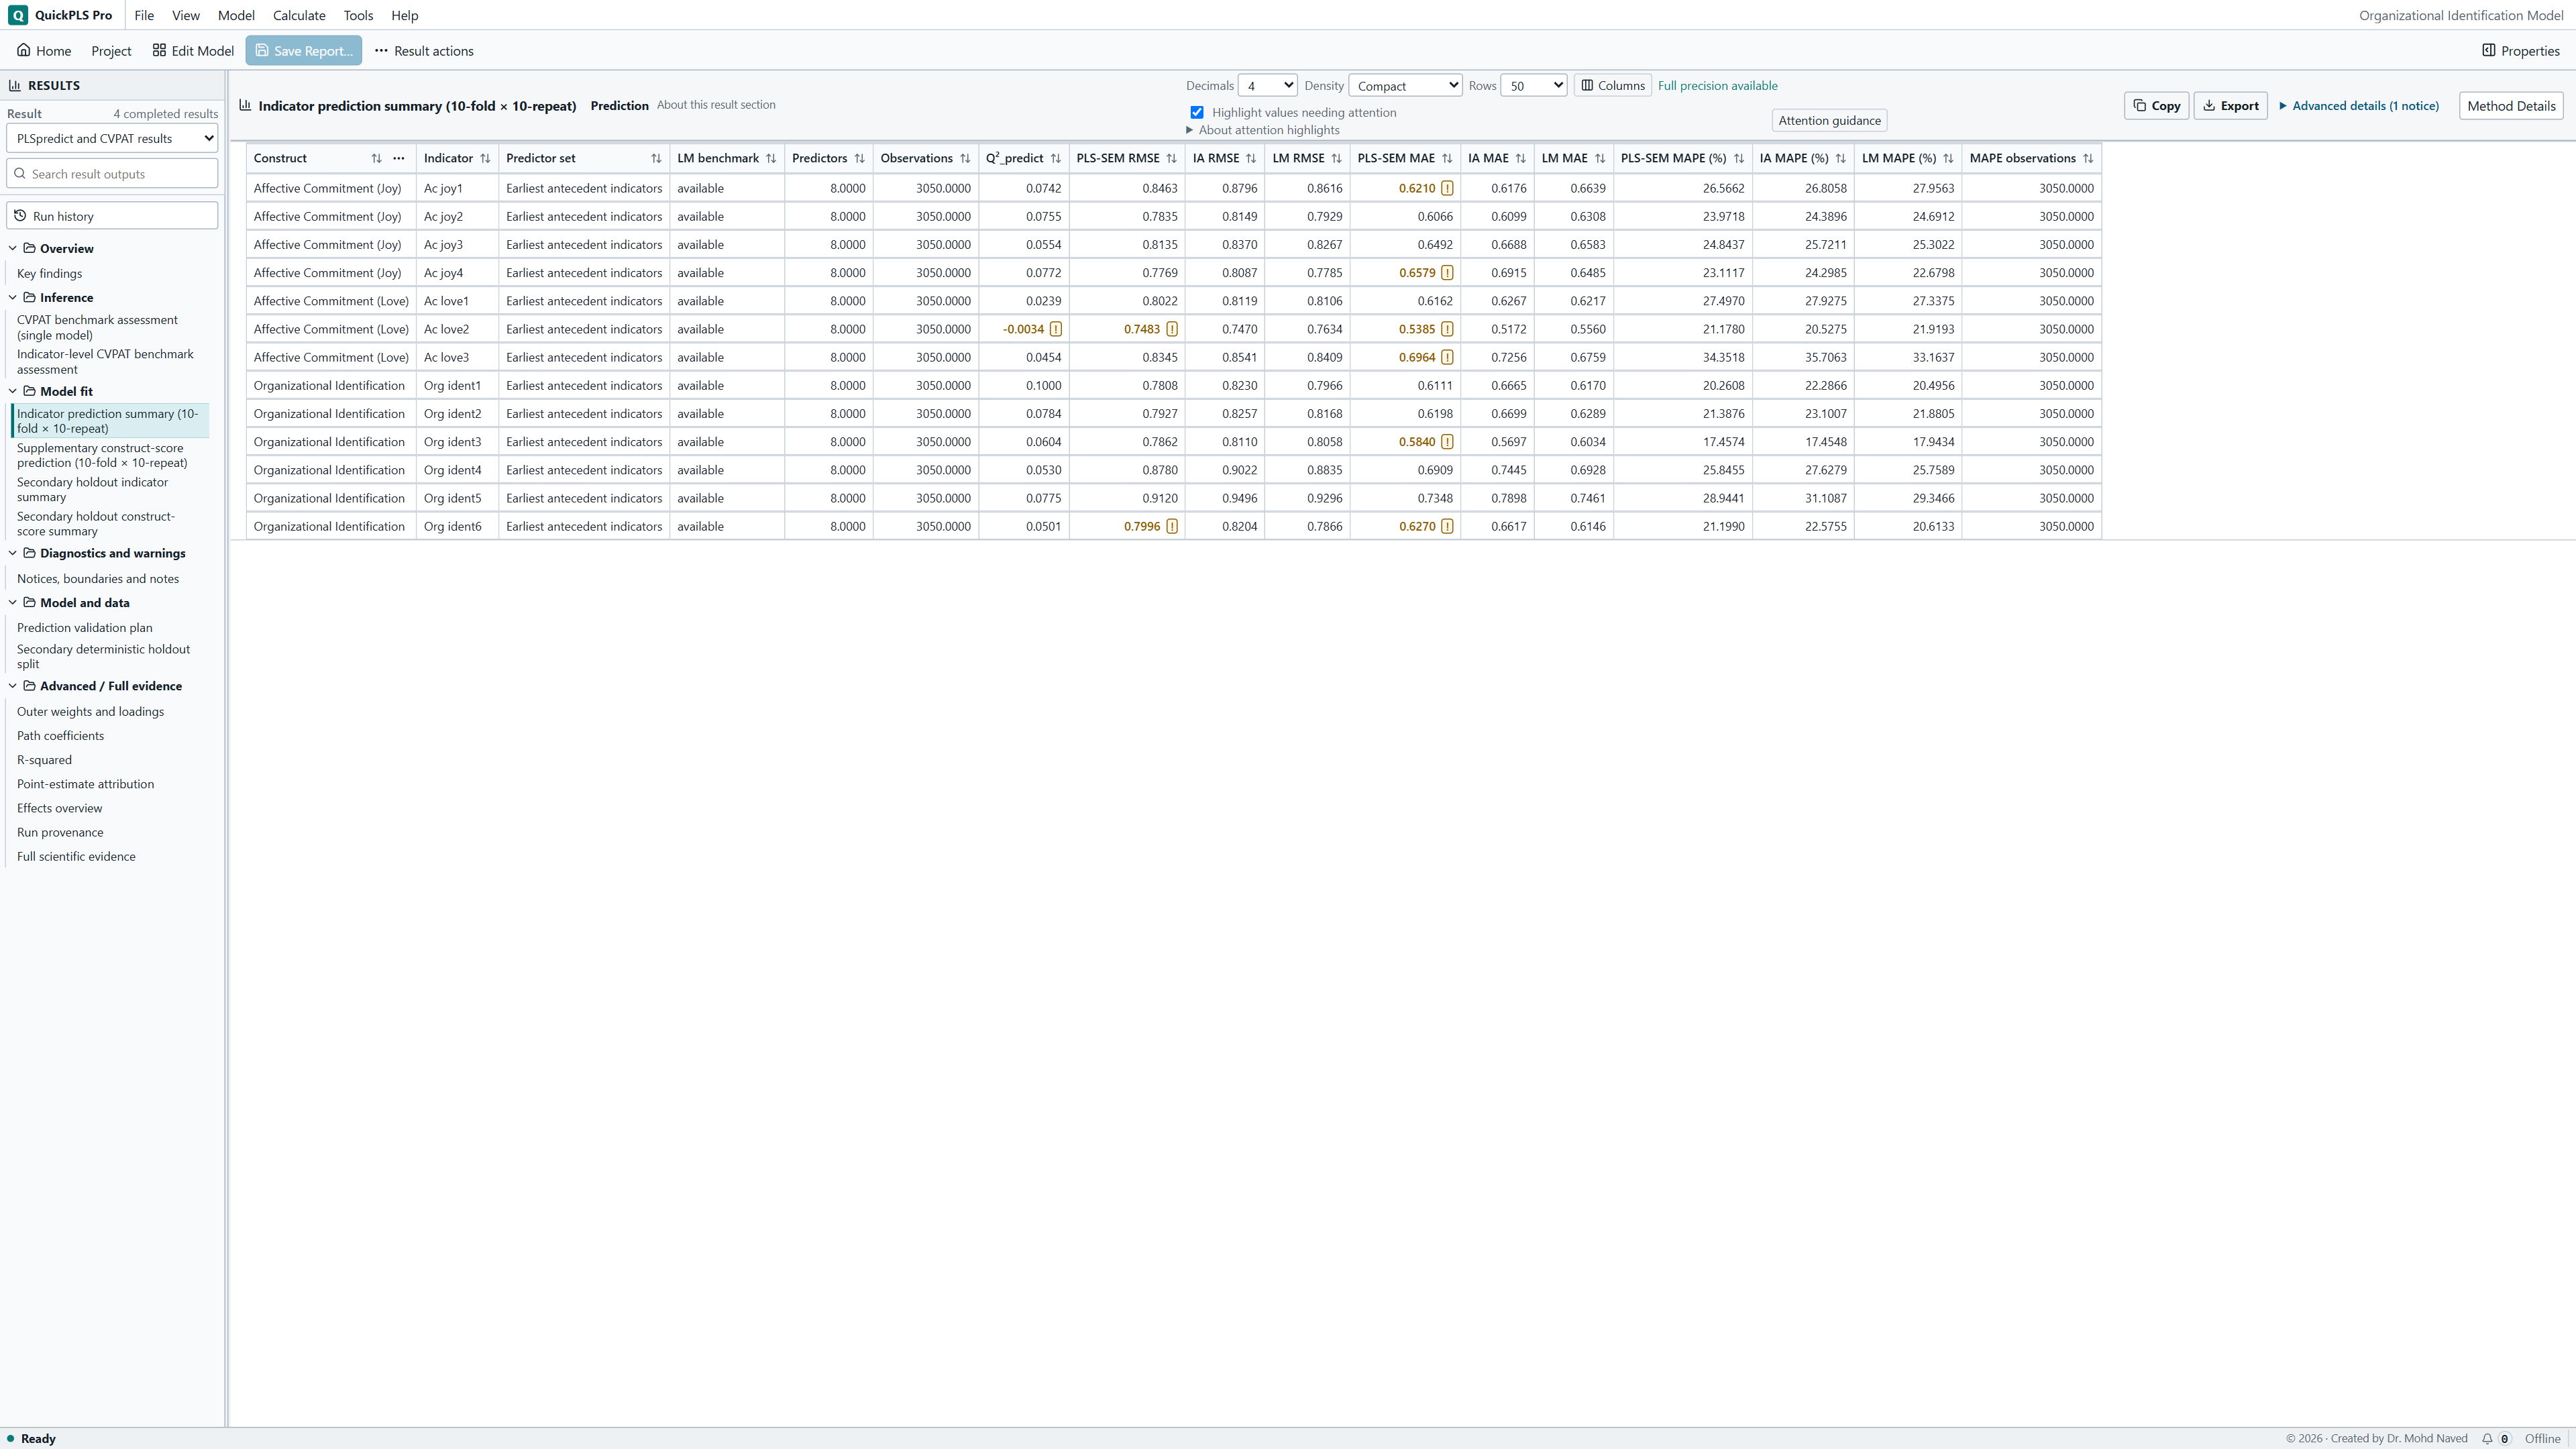
Open Model fit → Indicator prediction summary. Find each Satisfaction and Loyalty indicator and read RMSE and MAE against IA and LM. IA uses the training-fold mean; LM uses the predictor information allowed by the selected task. Check availability and the actual number of observations compared.
What you should see: Each indicator has errors on the same scale and cases.
How to read it: Compare the same error measure across models.
Read the paired tests
Open Inference → CVPAT benchmark assessment (single model). Read IA and LM separately, then use Indicator-level CVPAT benchmark assessment if needed. PLS loss minus benchmark loss is negative when PLS is better. Read the lower-tail test with that sign. Repeated predictions for one case are averaged before inference; repetitions do not multiply the independent participant count.
What you should see: Paired tests state their subtraction order and uncertainty.
How to read it: Read a negative difference only under that stated order.
Save the result and its split plan
Open Model and data → Prediction validation plan and check the recorded folds, repetitions and seed. Save or export it with the indicator errors, benchmark availability and CVPAT rows. Retain the source dataset, its row order and case selection. A changed or reordered dataset can produce different held-out assignments with the same seed.
What you should see: The saved result retains its split plan and settings.
How to read it: Report held-out performance separately from training R².
Read the errors first, then the comparison test
Open Model fit → Indicator prediction summary. Its title includes the recorded fold and repetition counts. Find one indicator, such as loyalty_1, and compare its PLS, IA and LM errors on the same scale.
RMSE means root mean squared error. It gives more influence to large mistakes. MAE means mean absolute error: the average size of a mistake without regard to its direction. A lower value is better for the particular error measure and target being compared.
Then open Inference → CVPAT benchmark assessment (single model). The configured procedure subtracts benchmark loss from PLS loss, so a negative difference favours PLS. Read the uncertainty and test probability with the comparison's status. An unavailable LM result does not count as a win over LM.
Use Search result outputs when a table is not visible in the left tree. Clear the search before moving to another part of Results. Historical results or different missing-data routes may use different output groupings.
On a small screen, swipe the table sideways to see every column.
| Output | How to read it | What to check |
|---|---|---|
| RMSE / MAE | Prediction error on held-out observations. | Compare the same target and scale; lower error is better for that loss. |
| IA / LM comparisons | Performance relative to indicator-average or linear-model predictions. | Name the benchmark rather than saying prediction is good in general. |
| CVPAT loss difference | The paired difference under the declared comparison and test. | Read the subtraction direction, uncertainty and failed folds. |
Beating the average is one useful result
In the illustration below, the two benchmarks lead to different conclusions. Keep both conclusions in the report; the linear comparison tells you something that the average-only comparison cannot.
Illustrative example, not a software benchmark
The model outperforms the indicator-average baseline but not the linear model. Report both findings. There is predictive information beyond a mean-only prediction, but no demonstrated advantage over the stronger linear comparison for that task.
State the prediction task and keep both benchmarks
- Name the target indicators and explain which predictors would be available when making a prediction.
- Record the fold count, repetitions, seed, preprocessing, independent case count and any failed calculations.
- Report the errors against IA and LM separately. State the CVPAT subtraction direction, uncertainty and whether the test concerns one indicator or the combined target set.
Use PLSpredict to compare unseen answers with actual answers
For each held-out customer, the model predicts the target indicators without using that customer's target answers during fitting. Once the prediction is made, its distance from the actual answer becomes the prediction error.
A model can explain its training sample well and still predict held-out customers poorly. Read the errors for every target indicator rather than using training R-square as a substitute. Keep the same target, usable cases and scale when comparing methods.
Define the task in one sentence
State which answers you want to predict and which answers you will already know. Then choose the folds, repetitions and seed that will be used to assess that task.
Run the recorded plan
Select PLSpredict / CVPAT in Calculate…. Complete the visible prediction controls and review Readiness before starting. Leave preparation inside the calculation so it is learned from training cases.
Read each indicator and both benchmarks
Open Indicator prediction summary under Model fit. Compare RMSE and MAE for PLS with IA and LM. Record missing or unavailable comparisons and any indicators whose conclusions differ from the overall pattern.
Use CVPAT to judge whether the error advantage is convincing
Suppose PLS makes slightly smaller errors than IA. CVPAT asks whether that observed advantage is supported by the paired case-level losses. A loss is the numerical cost assigned to a prediction error. Pairing means that the methods are compared on the same customers.
The configured result reports PLS loss minus benchmark loss. Negative values favour PLS; the lower-tail test asks whether PLS loss is lower. Check the named loss, target set, confidence level and status rather than reading the probability on its own.
An aggregate test combines the selected target errors. An indicator-level test asks about one indicator. Indicator-level probabilities are not adjusted for examining many indicators, so treat an exploratory search through them accordingly.
Identify the comparison you will interpret
For this single-model exercise, use the IA and LM rows produced by PLSpredict / CVPAT. Read the Loss column; the setup does not offer a separate loss or benchmark picker. For two compatible saved models, use the separate PLS Model Comparison method.
Open the correct result
In Results, choose the intended completed run. Open Inference → CVPAT benchmark assessment (single model) for the combined target set, or Indicator-level CVPAT benchmark assessment for individual targets.
Explain the direction and uncertainty together
Read the mean loss difference, interval or standard error, probability, independent case count and availability. State which benchmark and target set the conclusion concerns. A small negative estimate with uncertain evidence should be reported as uncertain.
Keep prediction separate from explanation
Training R-square describes fitted variation in the estimation sample. Blindfolding Q-square describes an omission-based reconstruction procedure. Neither replaces a test of predictions for held-out cases.
Report the outcome, information available at prediction time and benchmark beside the result. Those details explain where the finding applies.
Work through an error comparison
Suppose loyalty_1 has hypothetical RMSE values of 0.80 for PLS, 1.00 for IA and 0.75 for LM. PLS predicts better than the training mean but worse than the linear model. The predictors contain useful information; this comparison does not demonstrate an extra advantage from the PLS model.
For a separate arithmetic example, let squared-error totals be 64 for PLS and 100 for IA. Then Q²_predict = 1 - 64/100 = 0.36. The positive result means PLS improves on IA for this squared-error comparison. It says nothing by itself about LM. If IA's error total is zero, the ratio is undefined.
RMSE squares the errors before summarising them, so a few large mistakes can matter a great deal. MAE averages absolute mistakes. If they rank the methods differently, inspect the large errors and their practical consequences. Do not select whichever measure produces the preferred conclusion.
MAPE means mean absolute percentage error. Percentage errors can be difficult to interpret when actual indicator values are near zero. The implementation leaves actual zero values out of the MAPE denominator and reports how many observations remain; read that count with the value.
Now suppose an aggregate CVPAT comparison against IA has a mean loss difference of -0.12 and a lower-tail probability of 0.02. A separate LM comparison has a difference of 0.03 and probability 0.74. The IA result supports lower PLS loss for this task; the LM result does not. These hypothetical probabilities are a separate illustration and were not calculated from the RMSE example.
Try a later prediction point as a separate task
Suppose Satisfaction has now been measured and you want to predict Loyalty. Run a separate analysis with Predictor information → Direct antecedents. For Loyalty, the measured Satisfaction indicators of the held-out customer are now available as predictors; their transformation still uses training-only parameters.
In the earlier task, Loyalty had to be predicted from Quality and Trust through predicted intermediate information. Direct antecedents therefore provides different information. A lower error in this second task is not a free improvement to the first task.
Keep the folds, repetitions and seed matched when comparing these information scenarios. In a real study, explain when the additional measurements become available and whether collecting them is practical. Neither task may use held-out target answers to fit the model.
Use a weak result to find the next useful check
First separate a calculation problem from a valid but disappointing prediction. A missing benchmark or failed fit needs investigation. A completed model that predicts poorly is a finding to explain.
Read the affected indicator, benchmark status and warning before changing anything. The checks below help identify whether the issue is redundant information, an unavailable comparison, preparation that used held-out data, or uncertain evidence of an advantage.
On a small screen, swipe the table sideways to see every column.
| Symptom | Check | Reasonable action |
|---|---|---|
| Strong training R² but poor held-out errors | Whether the model generalizes beyond fitted cases | Report the predictive weakness and review complexity, measurement and omitted information; training fit does not overturn validation. |
| LM benchmark is unavailable | Whether redundant predictors make the training-fold regression impossible to estimate uniquely | Inspect redundant indicators and training sample size. Retain valid IA results, but do not claim victory over an unavailable LM. |
| Some indicators improve and others worsen | Target-specific errors and scale differences | Report the pattern and the prespecified aggregate comparison rather than highlighting only favourable indicators. |
| A negative loss difference is not significant | Its standard error and number of independent cases | Describe uncertain evidence of an advantage. More repetitions do not create new independent observations. |
| Results improve after global imputation | Whether held-out values influenced preprocessing | Redo the analysis with preparation learned from training rows only. |
| Q²_predict is missing | Whether IA squared error is zero | Report the undefined comparison; do not replace it with zero or one. |
Improve the model without training it on the answer key
When prediction is weak, identify a reason before revising the model. Redundant indicators may prevent a unique LM fit. An overly complicated model may fit its training cases closely but generalise poorly. Useful predictor information may be missing. Keep the original result and record the reason for each revision.
If you keep changing the model after reading the same validation results, the validation set starts acting like training data. Label that process exploratory. Use a fresh assessment for a final performance claim.
For two compatible saved PLS models with the same task, use PLS Model Comparison to share held-out cases and outcome definitions. A further untouched sample or suitable external validation strengthens a real deployment assessment. Time-ordered or clustered data require an appropriate validation design; ordinary shuffled folds do not reproduce those dependencies.
Describe what was predicted before reporting how well
A Methods paragraph for the teaching setup could read: We assessed Satisfaction and Loyalty indicator predictions using five-fold cross-validation repeated twice, with seed 20261105 and earliest-antecedent information. Preparation was fitted on training rows. We compared PLS with IA and LM using indicator errors and paired CVPAT loss differences at a 95% confidence setting. Indicator-specific tests were treated as unadjusted exploratory comparisons.
For the hypothetical example, write: The loyalty_1 RMSE was 0.80 for PLS, 1.00 for IA and 0.75 for LM. PLS improved on mean-only prediction but not on the linear benchmark for that indicator. Aggregate CVPAT findings were reported separately, with benchmark availability and the independent case count.
Replace the hypothetical numbers with your actual results. Retain disagreements across indicators and benchmarks; they explain the model's performance more clearly than a single favourable headline.
| Report item | Detail to include |
|---|---|
| Prediction task | Targets, available antecedents and when they are observed |
| Validation | Folds, repetitions, seed, cases and failed calculations |
| Preparation | Missing-data handling and training-only transformations |
| Errors | Indicator-level RMSE, MAE and benchmark availability |
| CVPAT | Loss direction, aggregate versus indicator level, uncertainty and multiplicity |
Check that you can explain your prediction result
- Describe what is known in the Earliest antecedents task and what extra information Direct antecedents allows.
- Explain a result that improves on IA but not LM.
- Calculate Q²_predict from the two squared-error totals.
- Locate the independent case count used by CVPAT.
- Explain why an unavailable benchmark is not evidence of an advantage.
- Give one example of a model revision that needs a fresh validation assessment.