 QuickPLS
What the method does
Measurement invariance of composite models (MICOM) assesses comparability of composite construction across groups. The procedure considers configural equivalence, compositional invariance and the equality of composite means and variances. Multigroup path comparisons then test explicitly defined group contrasts. Comparable measurement must be considered before interpreting a path difference.
Group path contrast: Δβ = βgroup 1 − βgroup 2.
The contrast must retain its group order and its own uncertainty. MICOM’s compositional question concerns whether the groups form the composite comparably; mean and variance equality are additional questions, not substitutes for that assessment.
Data and analysis in QuickPLS
Use the same indicator definitions and model structure, consistent data preparation and a group column. Check usable group sizes and the measurement assumptions.
QuickPLS provides the MICOM stages and PLS or PLSc group comparisons. Read the measurement stage first, then the specific path contrast for the selected pair.
Follow a worked example
The following example shows the data, settings and decisions for one analysis. Use the linked practice files to follow it. For your own study, keep the procedure and choose the variables, model and settings that fit your research question.
Download research-workshop.csv to begin. It contains 360 rows and 31 columns. The example below identifies the variables to use, their roles and any rows to exclude; not every column is an analysis variable.
Does the same relationship differ between groups?
Suppose Quality seems more strongly related to Satisfaction in one customer group than another. Comparing the two separate p-values cannot establish a difference. You need a direct comparison of the paths, and first you need evidence that the constructs have comparable meaning across the groups.
MICOM checks measurement invariance of composite models: whether the groups use comparable measurement specifications and form comparable component scores. Multigroup analysis then tests selected differences. QuickPLS brings the group definition, measurement review and supported comparisons into one setup.
Define the groups and check a common measurement model
Keep group membership in a separate data column, not as an indicator of a construct. Check the indicators, response coding, missing-data treatment, model specification and sign orientation across groups. Those practical checks form MICOM Step 1, called configural invariance.
Choose the paths you want to compare and the comparison rule before inspecting group results. Record group order because A minus B changes sign when the order is reversed. Use complete-case group counts rather than assuming the imported row totals are the analysis counts.
Choose the groups and validate the setup
Continue to setup opens the group choices and procedure controls. Use the workshop group column and the selected Quality → Satisfaction comparison below before validating the setup.
Open the group workflow
Click Calculate… → MICOM and Multigroup Analysis (PLS / PLSc), then Continue to setup. Choose the Grouping column and select the groups to compare.
Review measurement and choose the procedure
Select the appropriate Profile envelope, complete the MICOM Step 1 checklist after reviewing the data and model, and choose the needed MICOM and comparison procedures. Set Permutation and bootstrap draws, Alternative, Multiplicity and Parameters to compare.
Validate, calculate and read in order
Click Validate setup and address any blockers. Then Start calculation. In Results, check group eligibility and MICOM before interpreting the selected group differences.
Check comparability before interpreting path differences
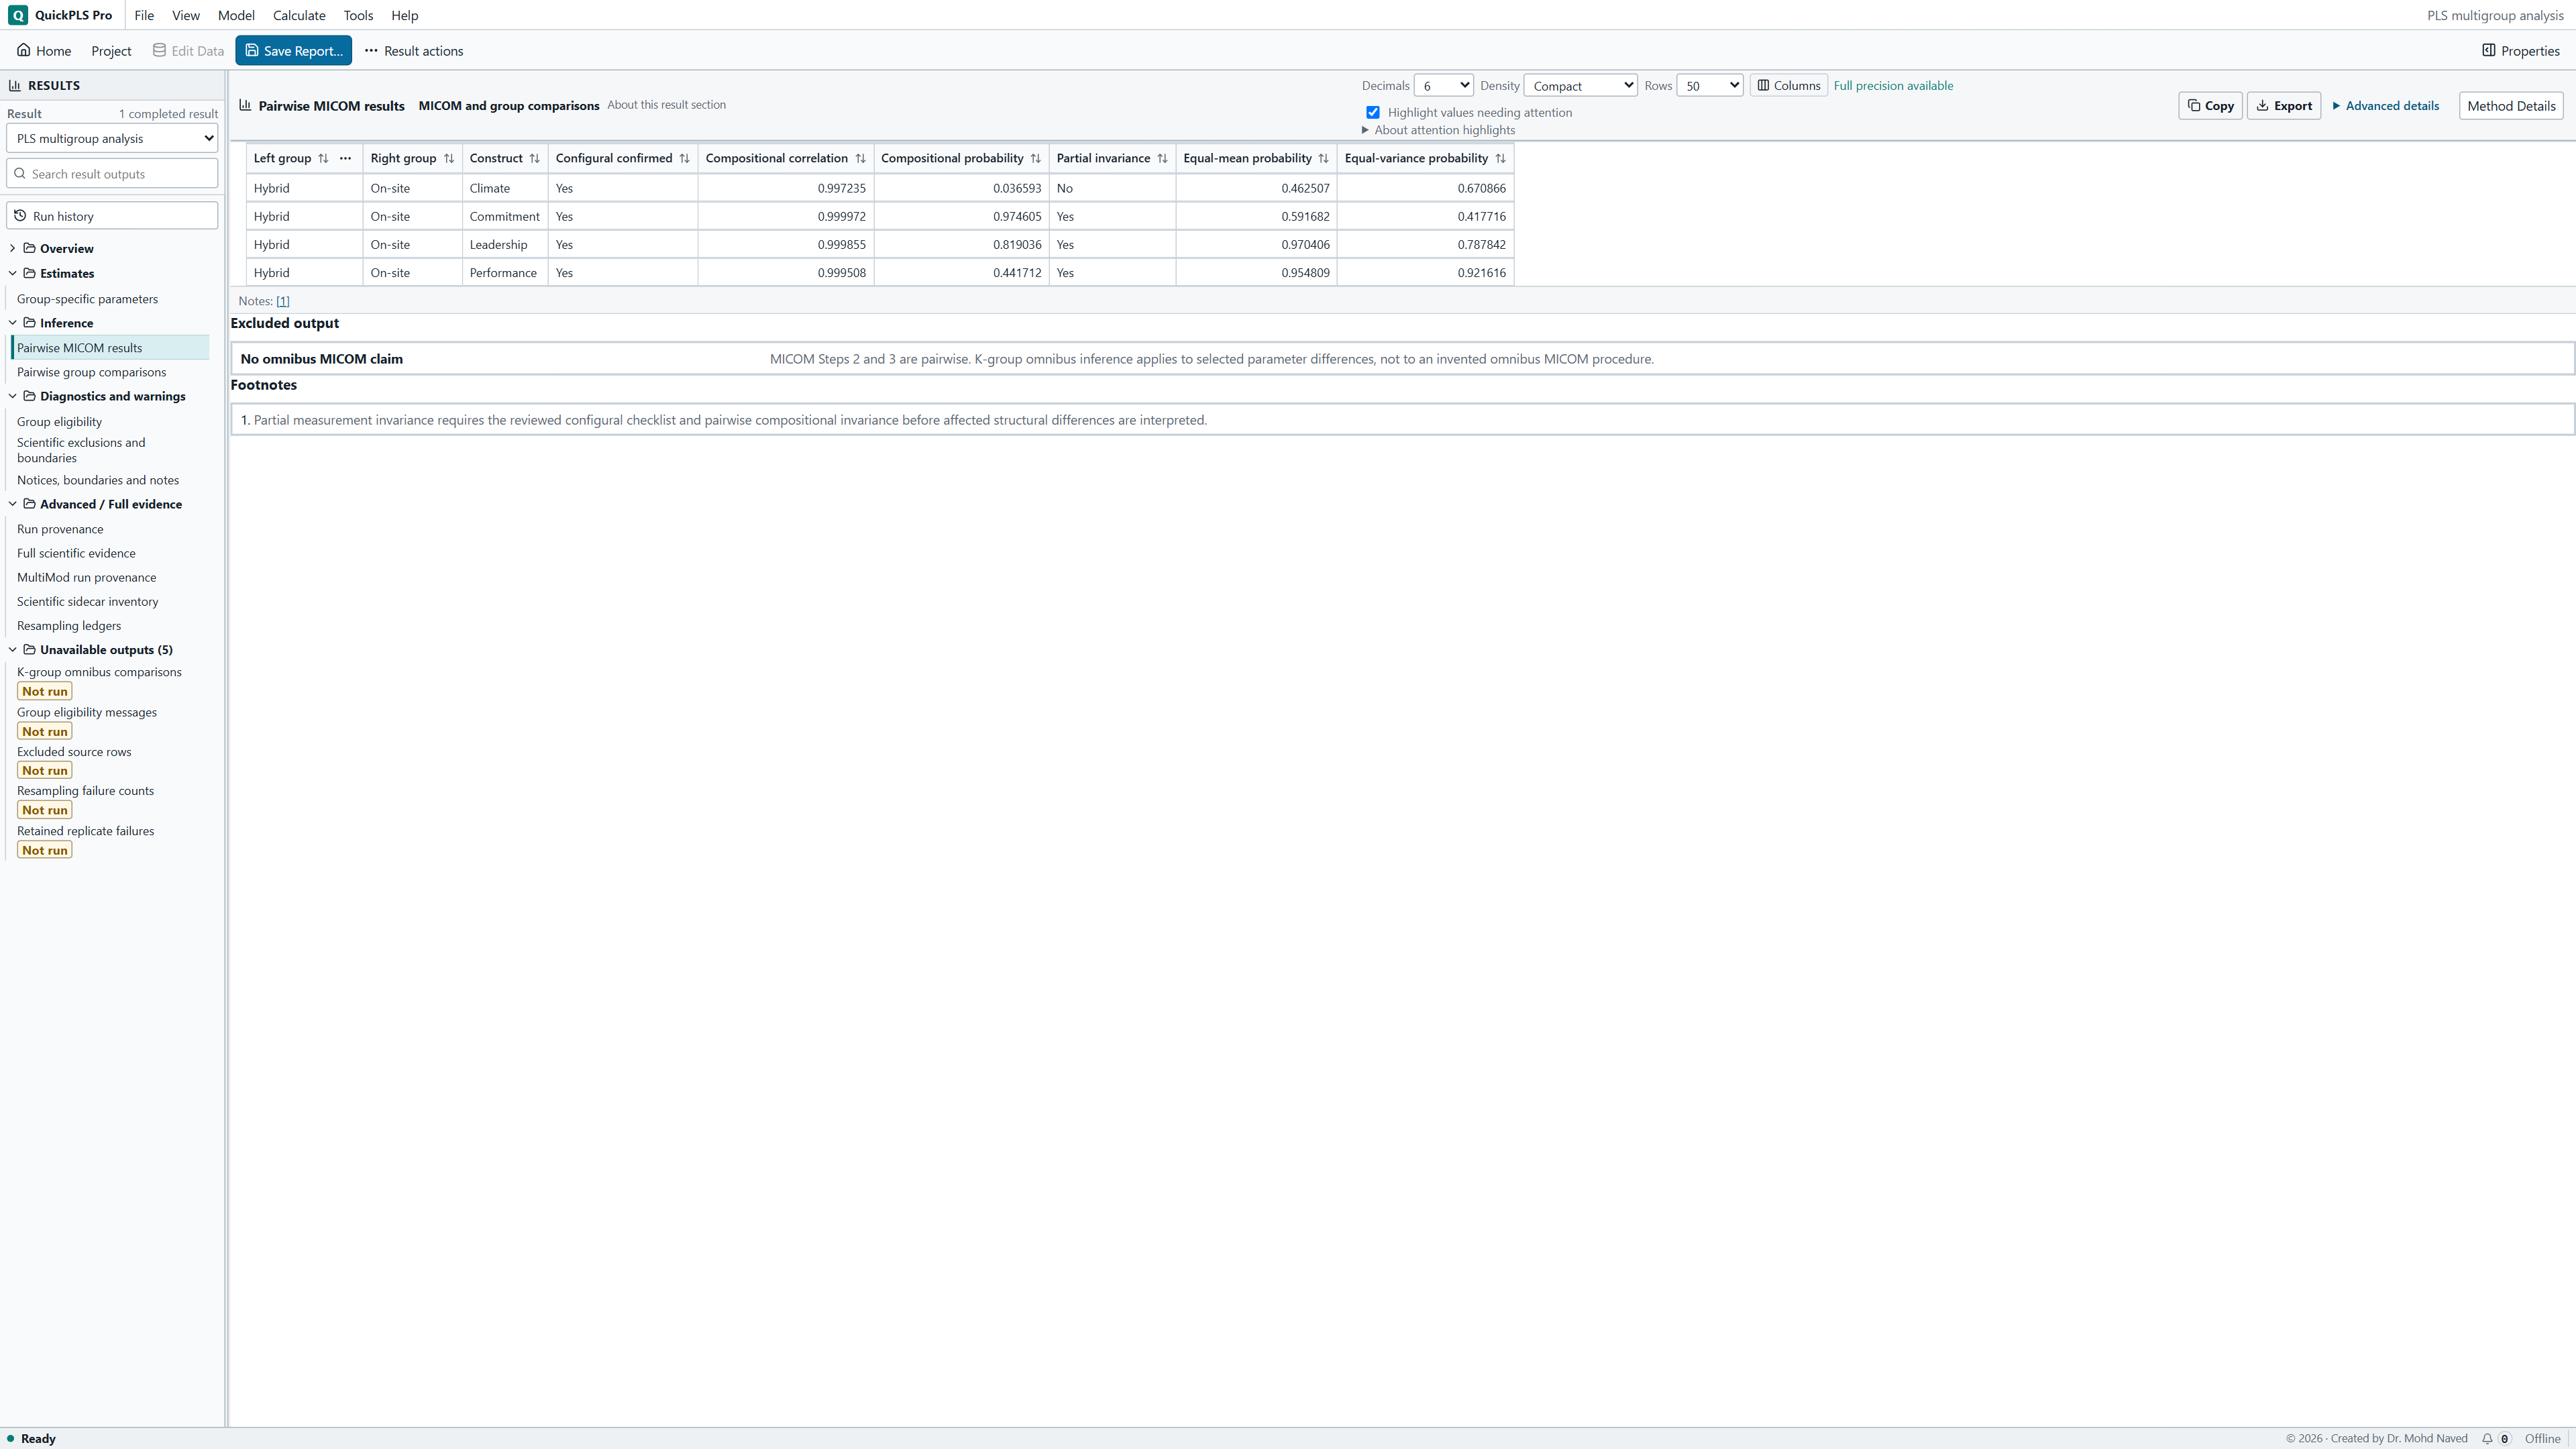
Start with Group eligibility and retained cases. Then inspect the pairwise MICOM results for the constructs involved in the comparison. Read the group-specific parameters alongside the pairwise differences, intervals or probabilities and the selected multiplicity adjustment.
A compositional correlation close to one can still fail the relevant invariance decision. Check the recorded Partial invariance status for each affected construct, rather than judging comparability from rounded similarity. If Quality or Satisfaction fails the required check, investigate that measurement difference before interpreting their path contrast.
On a small screen, swipe the table sideways to see every column.
| Output | How to read it | What to check |
|---|---|---|
| MICOM stages | Results for the separate stages of measurement comparability. | Do not skip the measurement question when a path differs. |
| Group estimates and contrasts | The selected parameter estimated in each group and the differences between groups. | Read group order and sample sizes. |
| Omnibus / adjusted pairwise results | An overall test across groups and adjusted tests of selected group pairs. | Multiple unadjusted pairwise tests can overstate discoveries. |
Test the group difference itself
A convincing group statement gives the estimate for each group, their difference, and the uncertainty for that difference. It also states whether the relevant constructs passed the required measurement-comparability checks.
Illustrative example, not a software benchmark
A path is statistically detectable in one group but not another. That alone does not establish a detectable difference between the paths. Test the contrast itself, instead of comparing the significance labels assigned to two separate estimates.
Practice: compare Quality → Satisfaction across two groups
Use the 360-case synthetic research-workshop.csv file. Its group column contains the balanced groups 0 and 1. Build the reflective Quality, Trust, Satisfaction and Loyalty blocks with the three ordinary paths used in the other exercises.
Keep group separate from the indicator blocks. The first teaching comparison concerns Quality → Satisfaction in group 0 versus group 1. Use the same indicators and specification in both groups.
The hypothetical comparisons below teach interpretation. They are not answers for the workshop file. Use the group names, retained counts and contrasts in your own saved result when completing the exercise.
Run the two-group workshop comparison
Choose the groups
Open Calculate… → MICOM and Multigroup Analysis (PLS / PLSc) → Continue to setup. Choose group as the Grouping column and select its two groups. Check the complete-case counts displayed after preflight.
What you should see: The selected groups and their usable cases match the intended comparison.
How to read it: Confirm the same indicators and coding.
Select the basic profile
Under Profile envelope choose Recursive PLS-SEM. Keep the model's indicator assignments and three structural paths unchanged for both groups.
What you should see: The requested comparison setup is selected.
How to read it: Check that it uses the intended PLS or PLSc procedure.
Complete the Step 1 review
Review the MICOM Step 1 checklist: indicators and coding, missing-data treatment, algorithm and resampling settings, structural and measurement specifications, and sign orientation. Confirm completion only when each statement is justified.
What you should see: The configural review records the common specification.
How to read it: A checked box should reflect a real comparison of the groups’ measurement setup.
Choose the two planned procedures
Select MICOM Steps 2–3, pairwise and Pairwise size-preserving permutation. Under Parameters to compare select Quality → Satisfaction for this exercise.
What you should see: The intended invariance and path procedures are selected.
How to read it: Read the invariance evidence before interpreting group paths.
Set the comparison rule
Set Permutation and bootstrap draws to 5000; the supported range is 5000 to 10000. Choose Two-sided and Holm FWER under Multiplicity. Holm controls the chance of at least one false-positive rejection within the stated family. Record the seed and worker settings provided for the run.
What you should see: The group order and comparison rule are explicit.
How to read it: They determine the contrast and its test.
Validate and calculate
Click Validate setup, read any group-size or model warnings, and resolve blockers. Click Start calculation. Review eligibility, MICOM Steps 2 and 3, group estimates and the selected path difference in that order.
What you should see: The completed result separates MICOM stages from path differences.
How to read it: Explain each conclusion at its own level.
Read partial and full invariance separately
Step 1 is the researcher's review of a common measurement specification. Step 2 checks whether the components are formed comparably across the selected pair. Support for Steps 1 and 2 gives partial invariance, which is the required basis for the affected standardized structural comparisons.
Suppose the Step 2 compositional correlation is 0.998 and the relevant lower permutation reference is 0.995. Read the actual decision and uncertainty in the output rather than deciding that any rounded value close to one passes. These numbers are a hypothetical illustration.
Step 3 evaluates equality of component means and variances. If Steps 1 and 2 are supported but Step 3 finds a difference, describe partial rather than full invariance. A mean or variance difference is not automatically a failure of the earlier component-comparability conclusion.
If Step 2 does not support compositional invariance for an affected construct, investigate measurement differences before interpreting its structural group contrast. Do not hide a failed stage behind another stage's favorable result.
Know what each group probability means
Suppose group A has Quality → Satisfaction = 0.50 and group B has 0.20. The A-minus-B difference is 0.30. The direct permutation or bootstrap comparison evaluates that difference; the separate significance labels of 0.50 and 0.20 do not.
Henseler PLS-MGA directional probability summarizes the share of bootstrap differences above zero, with half the ties included. A value of 0.97 indicates evidence in the A-higher direction under that procedure. It is not an ordinary two-sided p-value of 0.97. Reversing group order reverses the contrast and complements the directional probability.
Bootstrap difference · BC interval is a bias-corrected interval for the difference. BC is not BCa; the latter also includes an acceleration correction. State the method actually selected.
Parametric pooled variance, Welch–Satterthwaite and K-group inverse-variance Wald are ordinary PLS options with their stated assumptions. Their uncertainty calculations treat the estimated component scores as fixed, rather than repeatedly estimating the full measurement process. Do not present the procedures as interchangeable votes for significance.
Change the workflow carefully for PLSc or several groups
For Reflective PLSc, the reflective correction is applied within each group and relevant refit. Supported comparisons include permutation, bias-corrected bootstrap differences and multigroup permutation. Henseler PLS-MGA, pooled variance, Welch and inverse-variance Wald are not transferred to PLSc. Check correction failures and use the procedure shown for the selected profile.
The separate PLSc Consistent Permutation option supports exactly two groups and does not automatically run MICOM. Name it separately if you use it alongside the combined group workflow.
The combined workflow accepts 2 to 20 groups and requires at least 10 complete cases per group. It warns when a group has fewer than 30 complete cases or the largest group exceeds twice the smallest. An imbalance above 10:1 is blocked. These are execution checks, not proof of adequate statistical power.
For more than two groups, the procedure includes an overall maximum-spread permutation comparison before pairwise interpretation. The overall question is whether any selected parameter difference exists among the groups. It does not establish that every pair differs, and MICOM remains a pairwise assessment.
Check the group definition before changing the theory
Verify group coding and retained cases first, then locate the exact MICOM stage or comparison procedure behind the warning. A blocked calculation, incomplete comparability and an uncertain path difference are different findings and need different responses.
On a small screen, swipe the table sideways to see every column.
| Symptom | Check | Reasonable action |
|---|---|---|
| Step 1 cannot be confirmed | Coding, scales, preprocessing and model differences | Resolve documented inconsistencies or state why the intended comparison is not supported. |
| Compositional invariance fails | Which constructs and pairs are affected | Restrict interpretation of the affected path comparisons. Do not delete an item solely to make invariance pass. |
| A group is too small or extremely imbalanced | Complete-case counts and largest/smallest ratio | Reconsider the sampling plan and comparison feasibility; do not merge unrelated categories automatically. |
| A raw probability is small but its adjusted value is not | Declared family and selected adjustment | Report the adjusted result for that family rather than highlighting only the unadjusted value. |
| PLSc resampling is unavailable | Corrected fit failures and usable proportions | Review reliability corrections and whether the corrected matrices are mathematically valid; do not replace PLSc with ordinary estimates without explaining the changed analysis. |
| One group is significant and the other is not | The actual between-group contrast | Use the contrast's own inference before claiming a group difference. |
Check whether conclusions depend on avoidable choices
Keep the planned parameter family and multiplicity rule visible. If you add targets after inspecting results, describe that broader search instead of reporting only the smallest probability.
Reverse group order as a reading check: a signed contrast should reverse, while the substantive two-sided question remains the same. Do not interpret a Henseler directional probability as though it followed the ordinary p-value rule.
If invariance fails, inspect translation, coding, response use, item meaning and sample composition. Removing an item solely to pass MICOM can change what is measured. Any revision needs a substantive explanation and a fresh comparability assessment.
Treat small or highly unequal groups as a design issue even when the software can run. Use uncertainty and the relevant power considerations to decide what the study can reasonably conclude.
Write the measurement decision and contrast together
Methods example: We compared groups 0 and 1 using a common ordinary reflective PLS model. After reviewing the MICOM configuration, we requested pairwise MICOM and size-preserving permutation for the prespecified Quality → Satisfaction contrast, with 5000 draws, a two-sided alternative and Holm family-wise adjustment. Add the retained group counts, seed and worker settings.
Results example: The hypothetical group coefficients were 0.50 and 0.20, giving a 0.30 contrast in the stated order. Report the actual contrast inference and whether Steps 1 and 2 supported the relevant comparisons. Report Step 3 means and variances separately, using partial or full invariance accurately. These numbers are illustrative and are not workshop results.
| Report item | Detail to include |
|---|---|
| Groups | Definition, order, counts and exclusions |
| Measurement | Step 1 review and construct-specific Steps 2 and 3 |
| Estimator | Ordinary PLS or reflective PLSc profile |
| Tests | Procedure, parameters, pairs, overall test where relevant and adjustment family |
| Resampling | Planned and usable counts, failures and saved settings |
| Conclusion | Supported contrasts and any measurement-related interpretation limits |
Check that your group conclusion is supported
- Confirm that group membership is separate from the indicator blocks and that the coding is correct.
- Report the common-specification review and the MICOM result for each affected construct and pair.
- Use a direct parameter difference, not a comparison of separate significance labels.
- Interpret directional Henseler probabilities, two-sided probabilities and BC intervals according to their own definitions.
- State the group order, selected comparison family, multiplicity adjustment and complete-case counts.
- For PLSc or more than two groups, use only the procedures available for that profile and distinguish overall from pairwise conclusions.
Report the groups, comparability and direct contrast
- Define each group, report complete-case counts and state group order.
- Describe the Step 1 review and the MICOM evidence for the relevant constructs.
- Name the ordinary PLS or Reflective PLSc profile and each selected comparison procedure.
- Report group estimates, direct differences, matching inference, resampling counts and the multiple-comparison family.
Understand the three MICOM checks
MICOM asks whether you specified comparable measurements, whether the groups form the components comparably, and whether their component means and variances are equal. These are separate questions. A nonsignificant result does not prove exact equality.
Step 1: review the common specification
Check shared indicators and coding, missing-data treatment, algorithm settings, measurement and structural specifications, and sign orientation. Complete the checklist only after that review; the software cannot infer these decisions from a probability.
Step 2: check comparable component formation
Select MICOM Steps 2–3, pairwise in the group workflow. Read the compositional correlation with its permutation decision for each construct and pair. Evidence for Steps 1 and 2 supports partial measurement invariance.
Step 3: examine means and variances
Read the equality-of-means and equality-of-variances results separately. Meeting all stages supports full invariance. A Step 3 difference does not automatically undo the partial invariance supported by the earlier stages.
Compare ordinary PLS paths directly
For ordinary PLS, choose a procedure that tests the parameter difference you planned. A path being significant in one group and nonsignificant in another is not itself evidence that the two paths differ.
Select a common target
Choose the groups and the same structural parameter under Parameters to compare. Review MICOM for the constructs involved.
Choose the ordinary PLS comparison
For the basic exercise, use Recursive PLS-SEM and Pairwise size-preserving permutation. Set the resampling count, Alternative and Multiplicity before starting. Other supported procedures answer related questions under their own assumptions.
Read the contrast and its inference
Inspect each group's estimate and the A-minus-B difference. Use the probability or interval for that contrast and report the family used for the adjustment. Keep Henseler directional probabilities distinct from ordinary two-sided p-values.
Use comparisons that support corrected PLSc estimates
Reflective PLSc applies a consistency correction to account for measurement error in the supported reflective model. That correction must be valid within each group and during the relevant refits. A procedure available for ordinary PLS is not automatically available for these corrected estimates.
Check the reflective model within groups
Confirm that the measurement model and data support the correction. Review any warnings or failed corrections before interpreting group differences.
Choose Reflective PLSc
Under Profile envelope select Reflective PLSc. Choose one of its supported permutation or Bootstrap difference · BC interval procedures and set the resampling and comparison options.
Read the corrected comparison
Inspect corrected group estimates and their direct difference with the selected inference. Report failed corrections. Keep this workflow separate from PLSc Consistent Permutation, which is an exactly-two-group calculation and does not automatically include MICOM.
Use available groups and procedures for the intended question
The group workflow supports 2 to 20 groups within its eligibility rules. Passing those rules means the calculation can run; it does not establish that every group is large enough for the effects your study needs to detect.
MICOM Steps 2 and 3 remain pairwise. An overall comparison across several groups tests whether selected parameters differ somewhere; it does not establish that every pair differs. Invariance findings also do not prove that the groups are identical in every substantive respect.