 QuickPLS
What the method does
IPMA combines importance, usually the total effect on a selected target, with performance on a defined scale. The map helps identify constructs that have a strong fitted relationship with the target but comparatively low average performance. Any action recommendation still needs subject knowledge and a credible interpretation of the model.
Importance = total effect on the chosen target. Rescaled performance = 100 × (score − lower bound) / (upper bound − lower bound).
Total effects include eligible direct and indirect paths. Performance depends on the selected scale bounds and item direction. Comparing maps with different targets or inconsistent bounds can change their meaning.
Data and analysis in QuickPLS
Use an eligible model, a selected target and consistently oriented indicators with meaningful scale bounds. Document reverse coding and the performance scale.
QuickPLS produces importance and performance tables and maps for your target. Read both dimensions together before choosing which construct deserves further investigation.
Follow a worked example
The following example shows the data, settings and decisions for one analysis. Use the linked practice files to follow it. For your own study, keep the procedure and choose the variables, model and settings that fit your research question.
Download research-workshop.csv to begin. It contains 360 rows and 31 columns. The example below identifies the variables to use, their roles and any rows to exclude; not every column is an analysis variable.
Where should you look first when Loyalty is the goal?
Suppose you want to understand customer Loyalty. Your model links Quality and Trust to Satisfaction, then Satisfaction to Loyalty. Each of these concepts is a construct, measured by a group of questions. An importance-performance map helps you ask two questions together: which constructs have the stronger total relationships with Loyalty, and which have lower average performance?
Importance is the estimated total effect on the selected outcome, including the relevant indirect paths. Performance is the average score after applying the chosen scale. A construct with a larger importance value and lower performance may deserve closer investigation.
The outcome and the scale are part of the question. A map for Satisfaction can differ from a map for Loyalty. Scores can also change when you use the observed data range instead of the limits defined by a questionnaire. Keep those choices visible when discussing the map.
The map helps you decide what to investigate. To recommend an intervention, you still need to understand whether the construct can be changed, what that would cost and whether the observed relationship supports a causal claim.
Choose the outcome and understand the scale
The selected outcome is called the Endogenous target in QuickPLS. It must be a construct predicted by something else in the model. Its predecessors are the constructs that reach it through arrows: directly in one step or indirectly through another construct.
Before choosing performance ranges, check how each indicator was measured. A questionnaire with documented limits has a different basis from a synthetic file whose limits come from its observed values. Also inspect indicator coding and the fitted outer weights, which determine how the indicators contribute to a construct’s score.
The ordinary workshop map uses Indicator ranges, 0–100 (v2). Select the target before calculating, then inspect every indicator’s loaded limits. Keep the later Satisfaction cIPMA analysis separate because it changes both the target and the range convention.
Set up the map and find its tables
Open Importance-Performance Map Analysis
With the intended model open, click Calculate…. Type Importance-Performance Map Analysis in Find a method and select it. This setup uses the current model; it does not ask you to select a previously saved score result. If the list is collapsed, open Methods first.
Choose the target and ranges
Select the Endogenous target. For the range-based exercise, set Performance calculation to Indicator ranges, 0–100 (v2). Click Use full-dataset observed ranges. Expand each indicator’s row to inspect Minimum and Maximum. Choose Predecessors shown to match the question.
Run and open the coordinates
Review Readiness, keep Open Results when finished selected, and click Start calculation. In Results, check the selected run in the Result dropdown, then open Effects → Construct importance and performance. Read Indicator importance and performance for the indicator detail. Under Diagnostics and warnings, open Indicator scale limits to check the bounds and their source.
Read both coordinates for the selected target
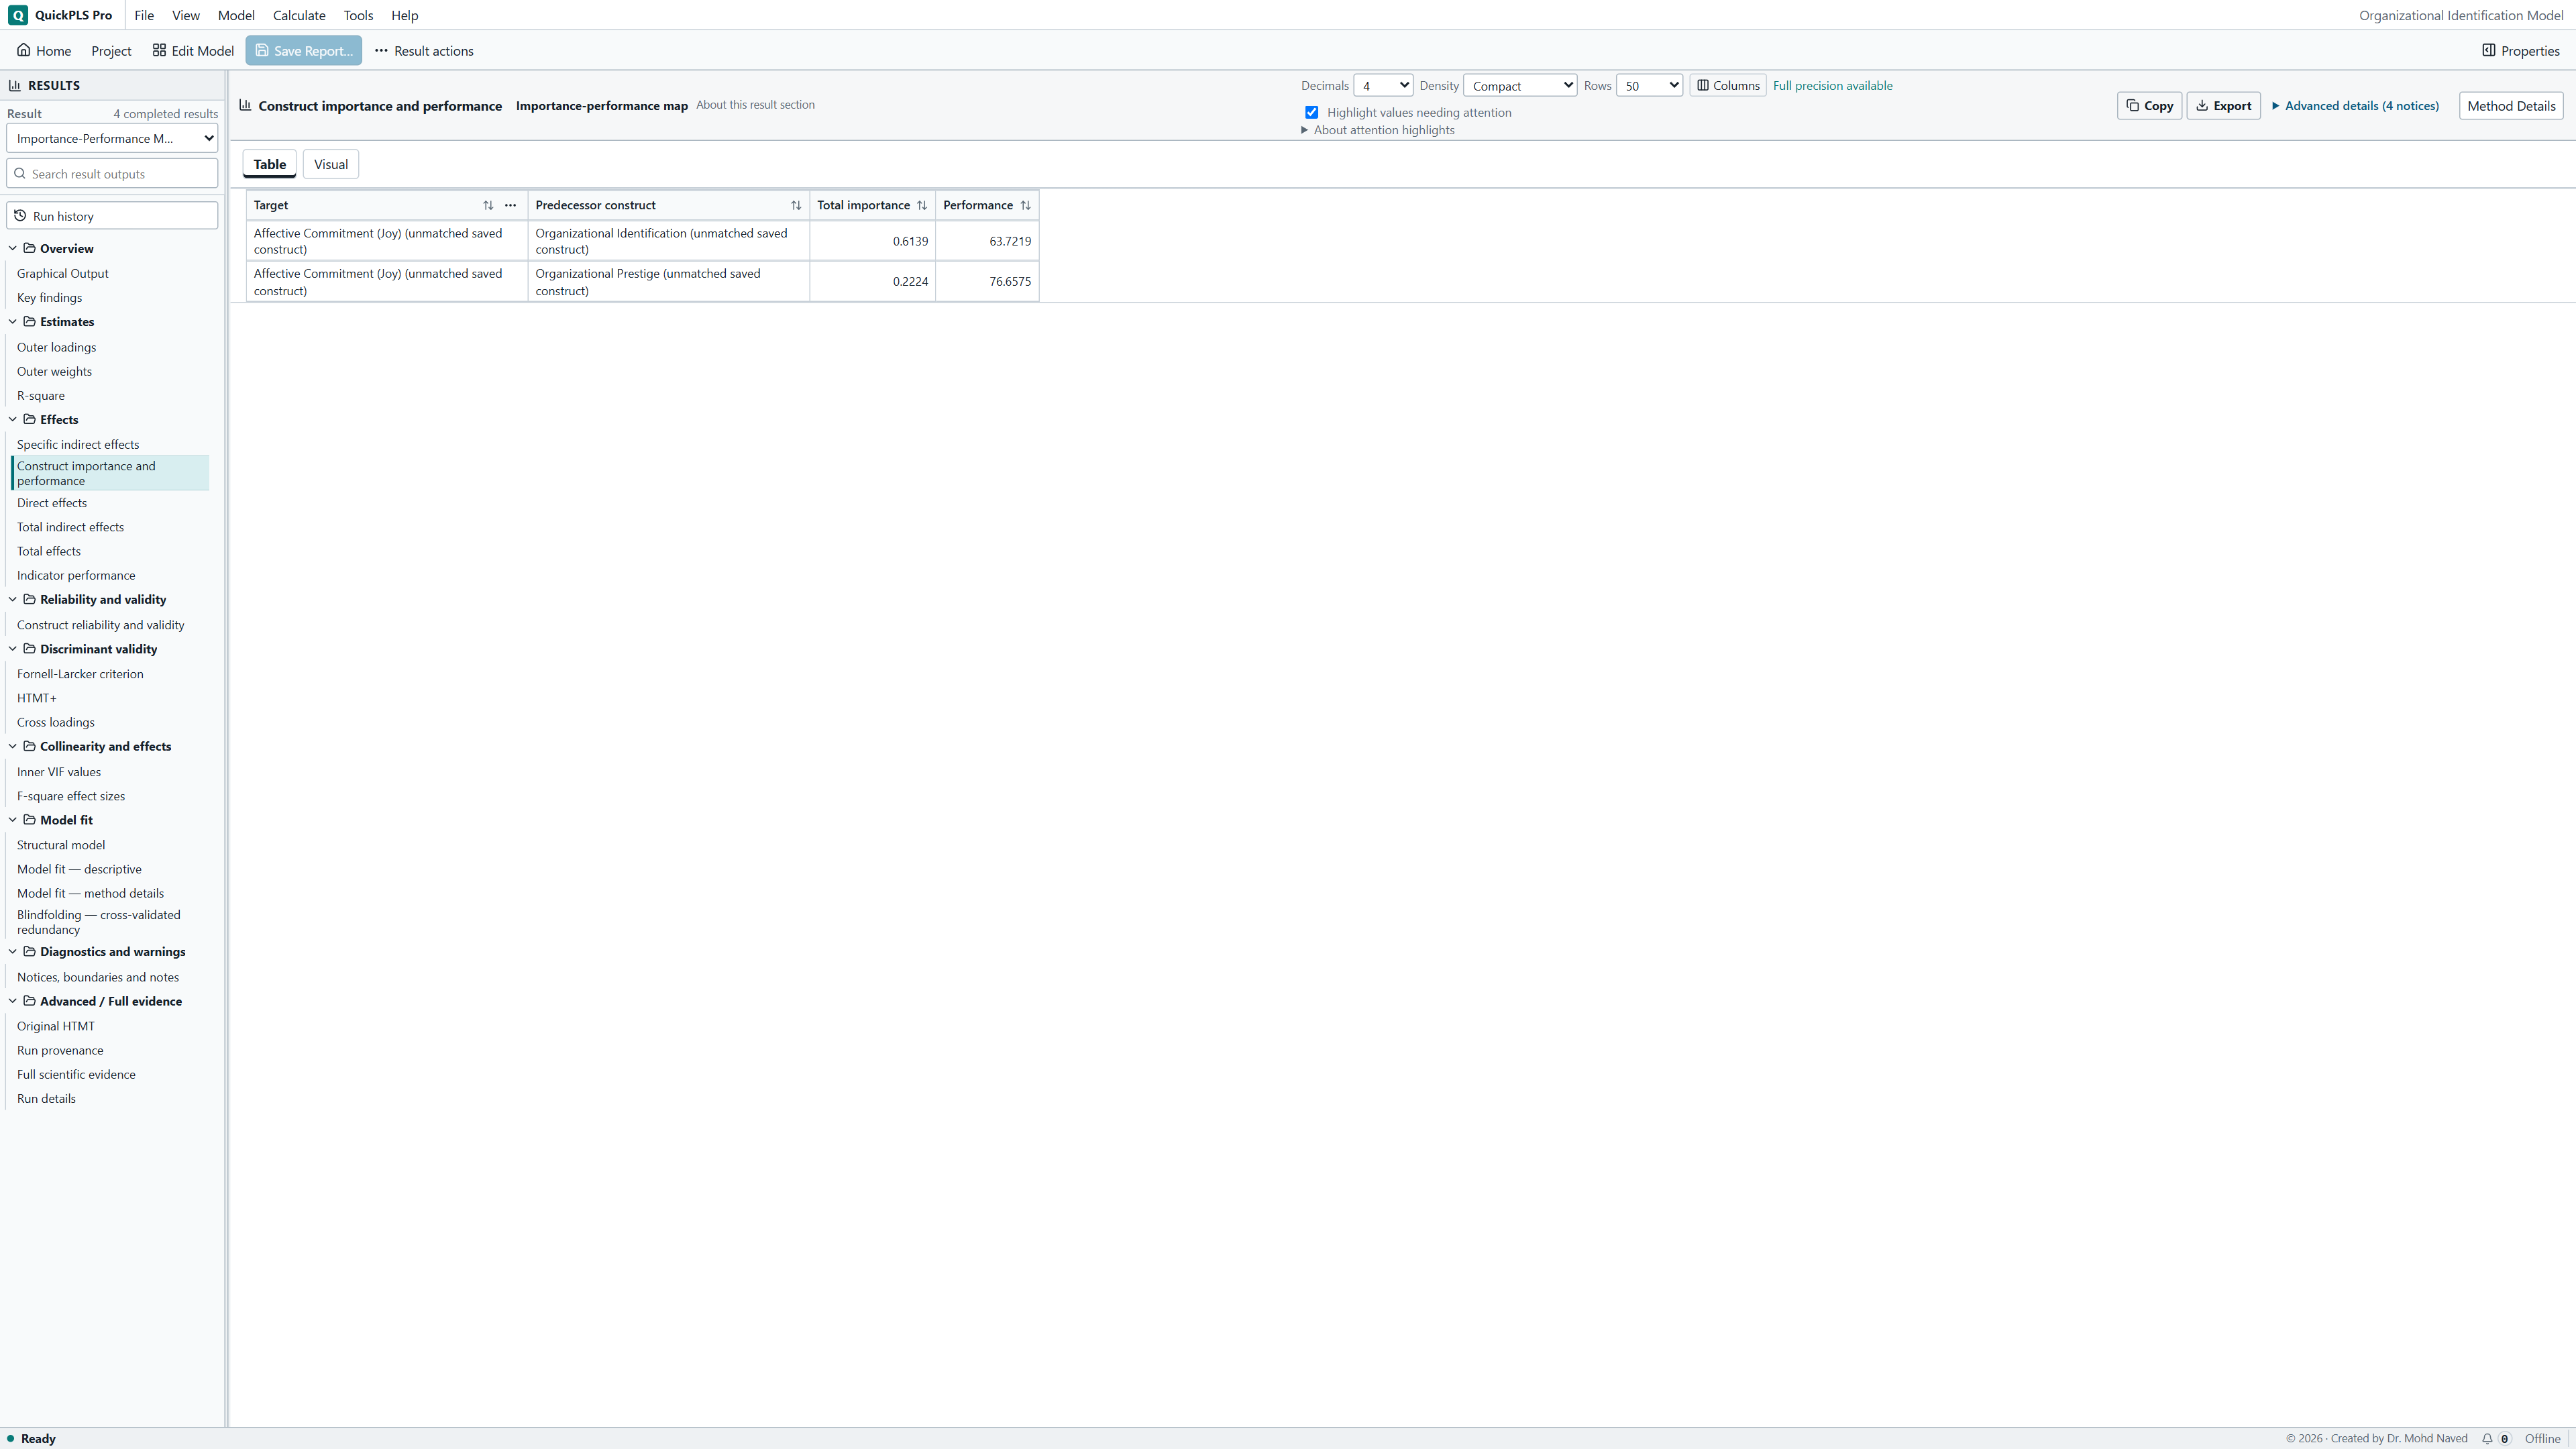
In Construct importance and performance, first check Target and Predecessor construct. Then read Total importance and Performance together. Importance includes the supported direct and indirect routes to that target. Performance describes the score on the scale you declared.
The direct-only predecessor view changes which constructs are shown. It does not change total importance into a direct path coefficient. If a construct disappears, check whether it has only an indirect route to the target before calling it unimportant.
Use Indicator importance and performance to examine the item-level picture, and Indicator scale limits to check the endpoints. Observed endpoints describe this dataset; theoretical endpoints come from the instrument’s definition. Coordinates using these different endpoints should not be treated as if the scale had stayed unchanged.
On a small screen, swipe the table sideways to see every column.
| Output | How to read it | What to check |
|---|---|---|
| Importance | The estimated total effect on the selected outcome under the chosen scaling. | Indirect paths and the target definition matter. |
| Performance | Average performance after scores are placed on the declared scale. | Observed-range and theoretical-range scaling are different. |
| Predecessor map | The constructs connected to the target through the paths included in the chosen view. | A missing construct may be ineligible, not unimportant. |
Use the map to guide a research question
Start with a plain statement about what you see: this construct has a stronger estimated relationship with the outcome and a lower performance score. The example below shows the additional questions to ask before turning that observation into advice.
Illustrative example, not a software benchmark
A high-importance construct with low performance may warrant investigation. Before recommending action, ask whether confounding could explain the association, whether the construct can be changed and whether the scale endpoints have practical meaning. The quadrant alone cannot answer those questions.
What to retain for a paper or management report
- Name the selected target and the direct or indirect predecessors included in the view.
- Explain that importance is the target-specific total effect and describe how performance was scaled.
- Save every indicator’s limits and their source with the map. Include warnings and unavailable results.
- Explain why a proposed priority matters in the study’s setting. Keep the observed association separate from evidence about the effect, cost or feasibility of an intervention.
Add the question: what minimum level appears necessary?
An ordinary map asks about importance and performance. Necessary-condition analysis, or NCA, asks another question: is there a minimum condition level below which the desired outcome is not reached under the chosen analysis? That minimum is often called a bottleneck.
The combined IPMA and NCA option, cIPMA, puts these questions beside each other. A construct can have modest importance but still show a bottleneck. Equally, high importance does not establish that a construct is necessary.
The combined option calculates with the current model’s target and scaled scores. There is no separate saved-score-result picker. Prepare the current setup’s ranges first, then add the necessity settings.
Prepare compatible performance ranges
Choose the Endogenous target and set Performance calculation to Indicator ranges, 0–100 (v2). Expand the indicator rows to inspect Minimum and Maximum. For cIPMA, indicators within each construct need the same minimum and the same maximum. All observed values must be inside those bounds, and fitted outer weights must meet the positive-weight requirement.
Enable and configure the combined analysis
Select Add necessity analysis to this IPMA calculation (cIPMA). Choose Conditions, Ceiling line and NCA scope. Enter Desired target score (actual 0–100), NCA permutations and cIPMA seed, and review Minimum effect-size convention and Significance-level convention. The desired score is an actual score on that scale, not a percentage of the observed range.
Read the requirement alongside the map
After calculation, open Effects → Combined importance, performance and necessity. Read Importance and Performance with Overall necessity, Necessary at target, Required performance, Cases below required and Requirement status. Check the selected ceiling and target range before interpreting an unavailable or unattainable requirement.
Keep the scale and the recommendation connected
A performance score is only meaningful with its range definition. Changing the bounds can change the map. Unsuitable limits or negative outer weights can also prevent a valid bounded performance calculation.
Check these issues before interpreting priorities. Then distinguish a useful association from a causal recommendation. The map does not calculate what would happen if a manager changed a construct, and it does not include the cost or feasibility of doing so.
Practice with a Loyalty map
Download research-workshop.csv and open the data guide. Use the four reflective constructs Quality, Trust, Satisfaction and Loyalty. Assign each construct its three matching indicators. Draw Quality → Satisfaction, Trust → Satisfaction and Satisfaction → Loyalty.
Choose Loyalty for the first map. Satisfaction is its direct predecessor because its arrow points straight to Loyalty. Quality and Trust are indirect predecessors because their routes pass through Satisfaction. This gives you a clear example of what the predecessor view changes.
The file contains 360 synthetic cases with invented continuous scores. It has no genuine questionnaire limits such as 1 and 7. Use the full dataset’s observed ranges for the ordinary IPMA exercise, and leave the arithmetic-mean columns out of the measurement blocks.
You will practise choosing a target, checking the ranges and finding the result tables. The numerical map and scaling examples below are illustrations, not checked output from this file. The later cIPMA exercise uses separately stated teaching bounds.
Build the ordinary IPMA result
Review the PLS model first
Run the ordinary PLS analysis and inspect the indicator coding and outer weights. If an item is reversed, correct it because its definition requires that coding. Do not reverse an item just to make the map look more favourable. Retain the original model and estimation settings.
What you should see: The original model and target are identifiable.
How to read it: Importance depends on the chosen outcome.
Select Loyalty as the target
Click Calculate…, find Importance-Performance Map Analysis and select it. Set Endogenous target to Loyalty. A later map for Satisfaction answers a different question and should be retained as a separate analysis.
What you should see: The target and performance settings are selected.
How to read it: Check that the requested paths lead to that target.
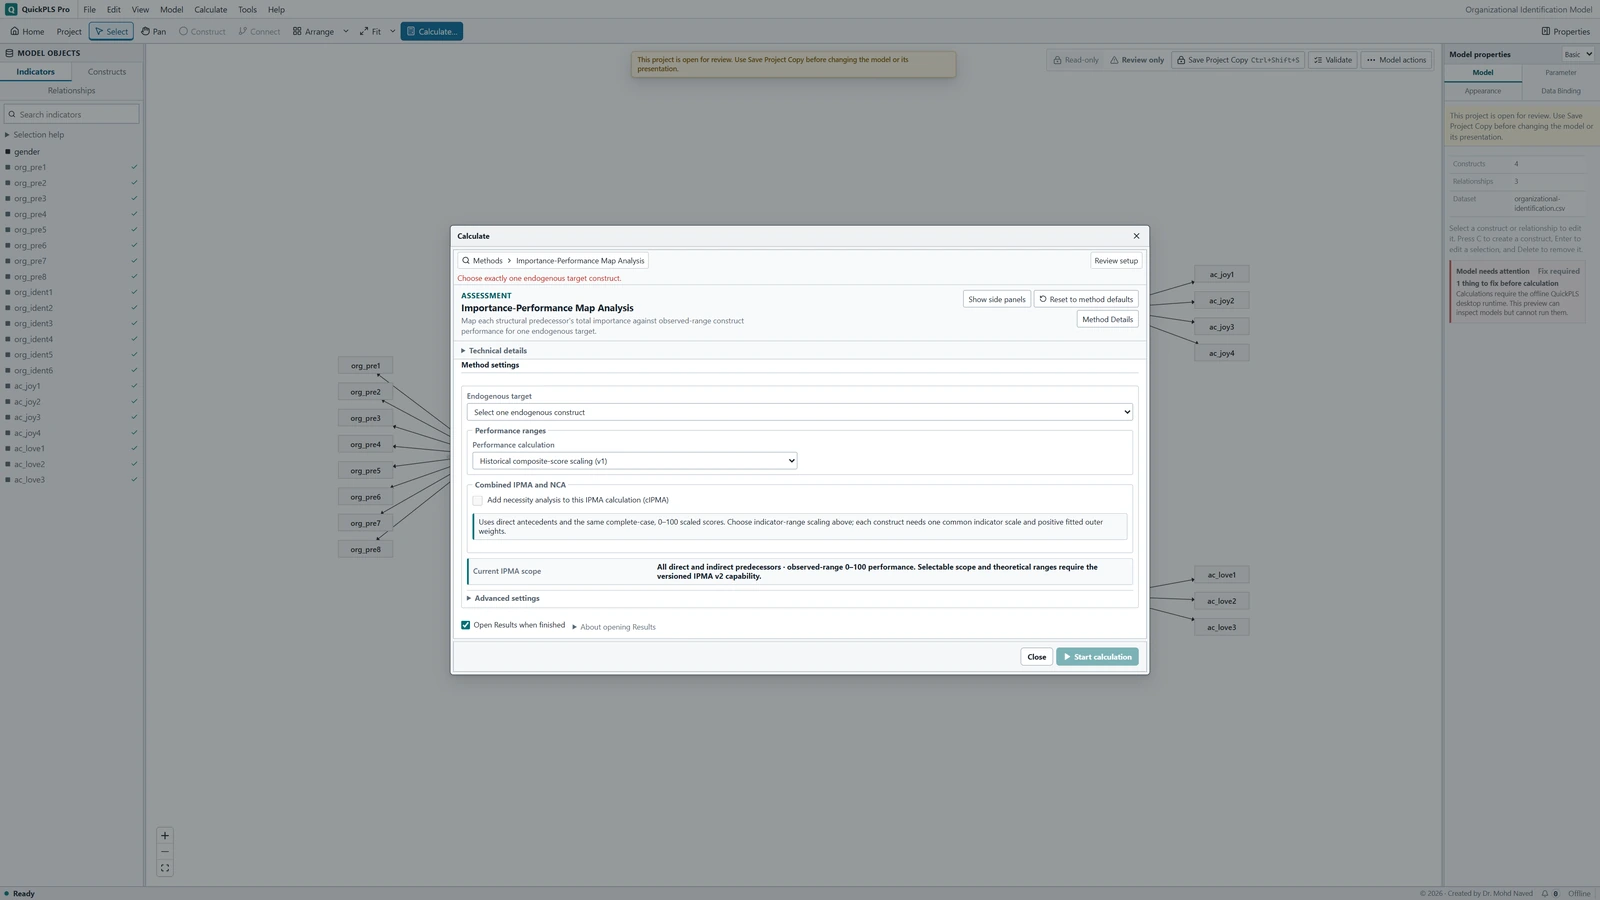
Importance-Performance Map Analysis settings in QuickPLS. Select your own dataset and model, then use the choices described in the steps. Load and inspect the indicator ranges
Set Performance calculation to Indicator ranges, 0–100 (v2). Click Use full-dataset observed ranges and wait for the ranges to load. Expand each indicator’s row and read Minimum and Maximum. Use theoretical metadata is a separate button for an instrument whose limits are genuinely documented; it is not justified by this synthetic file.
What you should see: Indicator direction and scale bounds agree with their meanings.
How to read it: Reverse coding or inappropriate bounds can reverse the performance interpretation.
Include the indirect predecessors
Set Predecessors shown to All direct and indirect predecessors. This includes Quality and Trust as well as Satisfaction for the Loyalty target. A separate Direct predecessors only view can help you check the difference, but it filters the displayed set rather than redefining total importance.
What you should see: All direct and indirect predecessors are included for Loyalty.
How to read it: Filtering this displayed set does not redefine total importance.
Calculate and examine the coordinates
Review Readiness and click Start calculation. Open Effects → Construct importance and performance and locate the Loyalty target. Read each predecessor’s Total importance and Performance, then open Indicator importance and performance for item detail. Check Diagnostics and warnings → Indicator scale limits and save the range settings with the result. The model’s original path coefficients and the map’s coordinates answer different questions.
What you should see: The saved map retains its target and scale.
How to read it: Treat improvement priorities as substantive judgments, not automatic causal recommendations.

Interpret a map without overclaiming
Suppose Quality has importance 0.40 and performance 55, while Trust has importance 0.15 and performance 75. Quality has the larger fitted importance value and lower performance in this hypothetical map. That is a reason to investigate Quality further. It does not calculate the effect or cost of improving it.
A performance score is not a percentile or the percentage of satisfied respondents. To see the scaling arithmetic, take one indicator value of 4 on a scale with limits 1 and 7. The transformation is 100 × (4 − 1)/(7 − 1), giving 50. These example limits are not appropriate metadata for the synthetic practice file.
Keep two types of negative value separate. A negative total effect is a signed relationship with the outcome and may be meaningful. A negative outer weight concerns how an indicator contributes to the construct score and can invalidate bounded performance scaling. The supported range-based calculation rejects negative outer weights.
Investigate coding and the measurement model when a weight blocks the map. Do not take absolute weights, remove an item or reverse its coding automatically. Any justified change belongs in the research record, together with its effect on the analysis.
Run a separate Satisfaction bottleneck exercise
Keep the ordinary Loyalty map and its observed ranges. Start a separate analysis for this lesson and identify it in your records as Satisfaction cIPMA teaching bounds. Select Satisfaction as Endogenous target. Quality and Trust are its direct antecedents: the constructs whose arrows enter Satisfaction.
Set Performance calculation to Indicator ranges, 0–100 (v2). Expand every indicator row for Quality, Trust, Satisfaction and Loyalty. Enter Minimum 0 and Maximum 8 for each indicator. These are common illustrative bounds for this synthetic lesson, not validated questionnaire limits. Check every observed value lies inside them. Within a construct, every indicator must have the same minimum and the same maximum.
Select Add necessity analysis to this IPMA calculation (cIPMA). Under Conditions, choose Direct antecedent constructs for this reflective model. Formative indicators of direct antecedents is a separate route with different requirements. Enabling cIPMA uses the direct-predecessor view. The separate observed limits from an ordinary IPMA run may not satisfy cIPMA’s common-range requirement.
Under Ceiling line, choose CE-FDH and CR-FDH if you want to compare the two available ways of drawing the necessity boundary. A ceiling line marks the boundary used to assess the combinations of condition and outcome scores. Under NCA scope, choose Observed score ranges for this practice analysis.
Inspect the available target range before entering Desired target score (actual 0–100). Enter a supported actual score, not a percentage of the observed span. Record NCA permutations, cIPMA seed, Minimum effect-size convention and Significance-level convention. These choices control the resampling and decision rules; they are not universal cutoffs to accept without thought.
Run the analysis and open Effects → Combined importance, performance and necessity. Compare the rows for each condition and ceiling. Read the importance and performance columns, then Overall necessity and Necessary at target. Required performance gives the estimated bottleneck at the selected target; Cases below required shows how many analysed cases fall short. Check Requirement status before interpreting a missing value.
For a hypothetical example, a condition with modest importance might require at least 60 when the desired target is 80. That finding identifies a bottleneck under the selected ceiling method. Raising the condition to 60 does not guarantee an outcome of 80. High IPMA importance also does not, by itself, prove necessity.
The combined analysis uses the same target, direct antecedents, eligible complete cases and scaled scores. It requires strictly positive fitted outer weights and compatible declared scales. The permutation probabilities concern necessity; they do not test the significance of the PLS importance effects. Report the two types of evidence separately, including any undefined requirement.
If a range, weight or requirement causes a problem
Start with the setup rather than trying to improve the ranking. Check the chosen target, the origin of the indicator limits and whether the ordinary or combined analysis is selected. Then use the table to investigate the specific message or missing result.
For the range-based route, expand the affected indicator to inspect its Minimum and Maximum. Values outside the declared bounds are rejected, not silently clipped. For cIPMA, check both endpoints match across indicators within a construct.
On a small screen, swipe the table sideways to see every column.
| Symptom | Check | Reasonable action |
|---|---|---|
| A performance range is invalid | Inspect missing limits, equal minimum and maximum, and the origin of each range. | For a real instrument, correct documented scale metadata or use observed ranges explicitly. For this separate cIPMA exercise, retain the stated common synthetic teaching bounds and inspect that every value lies inside them. |
| A negative weight blocks the map | Check coding, measurement specification and the distinction between outer weights and path signs. | Retain the estimation result and review the measurement question. Do not silently take absolute weights. |
| A predecessor disappears in the direct view | Check whether its relationship to the target is indirect. | Restore the all-predecessor view or report the direct-only scope. Do not call the omitted construct unimportant. |
| A cIPMA requirement is unavailable | Inspect the target range, ceiling method, variation in the condition and selected score range. | Report the unavailable requirement with its reason. Do not substitute zero or extrapolate beyond supported scores. |
| A map changes after switching range definitions | Compare the observed limits with any limits defined by the instrument, and record where each came from. | Describe the scale sensitivity. Do not compare coordinates as if they used an unchanged metric. |
Check whether your conclusion depends on the choices
With a real questionnaire whose theoretical limits are justified, compare maps using those limits and the observed limits. Keep the original model and explain why the coordinates change. A higher performance score after changing the scale is not evidence that the respondents themselves improved.
For the ordinary synthetic-data exercise, retain observed ranges and explore the target instead. A Satisfaction map answers a different question from a Loyalty map, so keep it as a separate named analysis. Use the stated common teaching bounds only for the separate cIPMA lesson.
Before making a recommendation, consider uncertainty, costs and whether a practical intervention could change the construct. For cIPMA, compare the selected ceiling methods and report disagreements in their requirements. Do not select the scale, target or ceiling merely because it gives the priority you hoped to recommend.
Explain the map’s scale as well as its findings
After completing the exercises, a methods paragraph could say: “We calculated an IPMA for Loyalty using full-dataset observed indicator ranges and included all direct and indirect predecessors. A separate cIPMA teaching analysis targeted Satisfaction. It used common illustrative limits of 0 and 8 for every indicator of the four constructs; these were not validated instrument limits. We recorded the direct antecedent conditions, ceiling method, score scope, permutations and decision settings.” Use this text only if it matches your saved analyses.
For the hypothetical map, a results paragraph could say: “Quality had importance 0.40 and performance 55, compared with 0.15 and 75 for Trust. This pattern suggested Quality as a subject for further investigation.” Explain that this is an association in the fitted model, rather than an estimated intervention effect.
Replace those invented values with your actual results before reporting the practice file or a research study. Add cIPMA findings separately, including the desired target, ceiling, necessity decision, required performance and unavailable reasons. The reporting table helps you keep the scale and the interpretation traceable.
| Field | Report |
|---|---|
| Target and model | Selected outcome, predecessor view and original PLS specification. |
| Performance scale | Limits and their origin for every indicator; treatment of weights. |
| Map results | Importance and performance together, with unavailable values. |
| cIPMA extension | Conditions, ceiling, score scope, desired score, permutations and conventions. |
| Recommendation | Substantive rationale, feasibility and limits on causal interpretation. |
Check that you can explain the map
- Explain why a performance score of 55 is neither a percentile nor the percentage of satisfied respondents.
- Point out the direct and indirect predecessors of Loyalty, then explain what changes when Satisfaction becomes the target.
- Identify where you recorded each indicator’s Minimum and Maximum and why those limits are appropriate.
- Distinguish a negative total effect from a negative outer weight before deciding what to investigate.
- Explain why satisfying an NCA bottleneck does not guarantee the outcome.
- Report ordinary importance and performance separately from the added necessity assessment and its desired target.