 QuickPLS
What the method does
A higher-order component summarises dimensions that have their own indicators. The model therefore has two measurement levels: indicators form the lower-order components, and those components contribute to the broader concept. The dimensions and their direction must be justified before estimating a higher-order relationship.
Higher-order score: H = ΣⱼaⱼCⱼ.
Cⱼ is a lower-order component score and aⱼ is its contribution to the higher-order score H. The complete estimation also includes the indicator and structural equations. A large aⱼ describes the fitted composition; it does not by itself make that dimension the most important substantive cause.
Data and analysis in QuickPLS
Use indicator-level observations, defined lower-order components, and their higher-order assignment. Avoid treating duplicate indicators or overlapping dimensions as independent information.
QuickPLS supports the higher-order GSCA specification and its component and effect outputs. Apply it to your own hierarchy, checking each level before interpreting the paths involving the higher-order concept.
Follow a worked example
The following example shows the data, settings and decisions for one analysis. Use the linked practice files to follow it. For your own study, keep the procedure and choose the variables, model and settings that fit your research question.
Download research-workshop.csv to begin. It contains 360 rows and 31 columns. The example below identifies the variables to use, their roles and any rows to exclude; not every column is an analysis variable.
Can several dimensions describe one broader concept?
Suppose organizational Readiness consists of Resources, Support and Capability. Each dimension has its own survey items, but your research question concerns Readiness as a whole. A higher-order model connects those measured dimensions to the broader concept.
Higher-order GSCA uses a disjoint two-stage approach: it estimates the lower-order dimension scores first, then uses those scores in the higher-order model. Decide whether the dimensions form the broader concept or reflect it before calculating. That choice comes from the meaning of the concept.
Define the dimensions before opening the method
Prepare the lower-order indicator blocks and the higher-order construct in a saved model. Check that each dimension belongs to the intended broader concept, that the chosen measurement directions match your theory, and that the model uses the disjoint two-stage construction approach.
The saved higher-order model must already contain Readiness and its three selected dimensions. Prepare a GSCA setup reads that model and derives the two estimation stages; it does not create the hierarchy for you.
Prepare a two-stage GSCA setup
Choose the higher-order model
Open Calculate… → Higher-order GSCA and click Prepare a GSCA setup. Choose the Saved higher-order model and enter a New setup name.
Preview the two stages
Click Preview setup to derive the stages. Check which dimensions are estimated first and how their scores enter the higher-order model. Use Change stage settings if you need to review the stage-specific options.
Save, calculate and read both stages
Choose the shared Inference settings. Preview again after changes, click Save new setup and Use saved setup, then Check saved setup and Start calculation. Click Open Results and review the first-stage scores as well as the second-stage relationships.
Follow each dimension into the higher-order model
In Results, use Search result outputs to open First stage estimates and First stage component scores. Check the lower-order dimensions and their score definitions, then open Second stage estimates and Second stage component scores. Use Higher-order settings and source details to check how the dimensions enter Readiness before interpreting its weights and structural paths.
A bootstrap interval for a higher-order relationship should reflect uncertainty in both stages. Treating estimated first-stage scores as perfectly known can make the final relationship appear more certain than the full procedure supports.
On a small screen, swipe the table sideways to see every column.
| Output | How to read it | What to check |
|---|---|---|
| Stage-one components | The lower-order measurement and scoring solution. | Check which first-stage analysis produced the scores and which indicators define each dimension. |
| Stage-two higher-order result | The broader construct estimated from the specified first-stage scores. | Label coefficients by stage rather than combining them without explanation. |
| Raw-case refits / effects | Uncertainty and effects under the supported two-stage procedure. | Resampling only the second-stage scores holds their original estimation fixed and omits that source of uncertainty. |
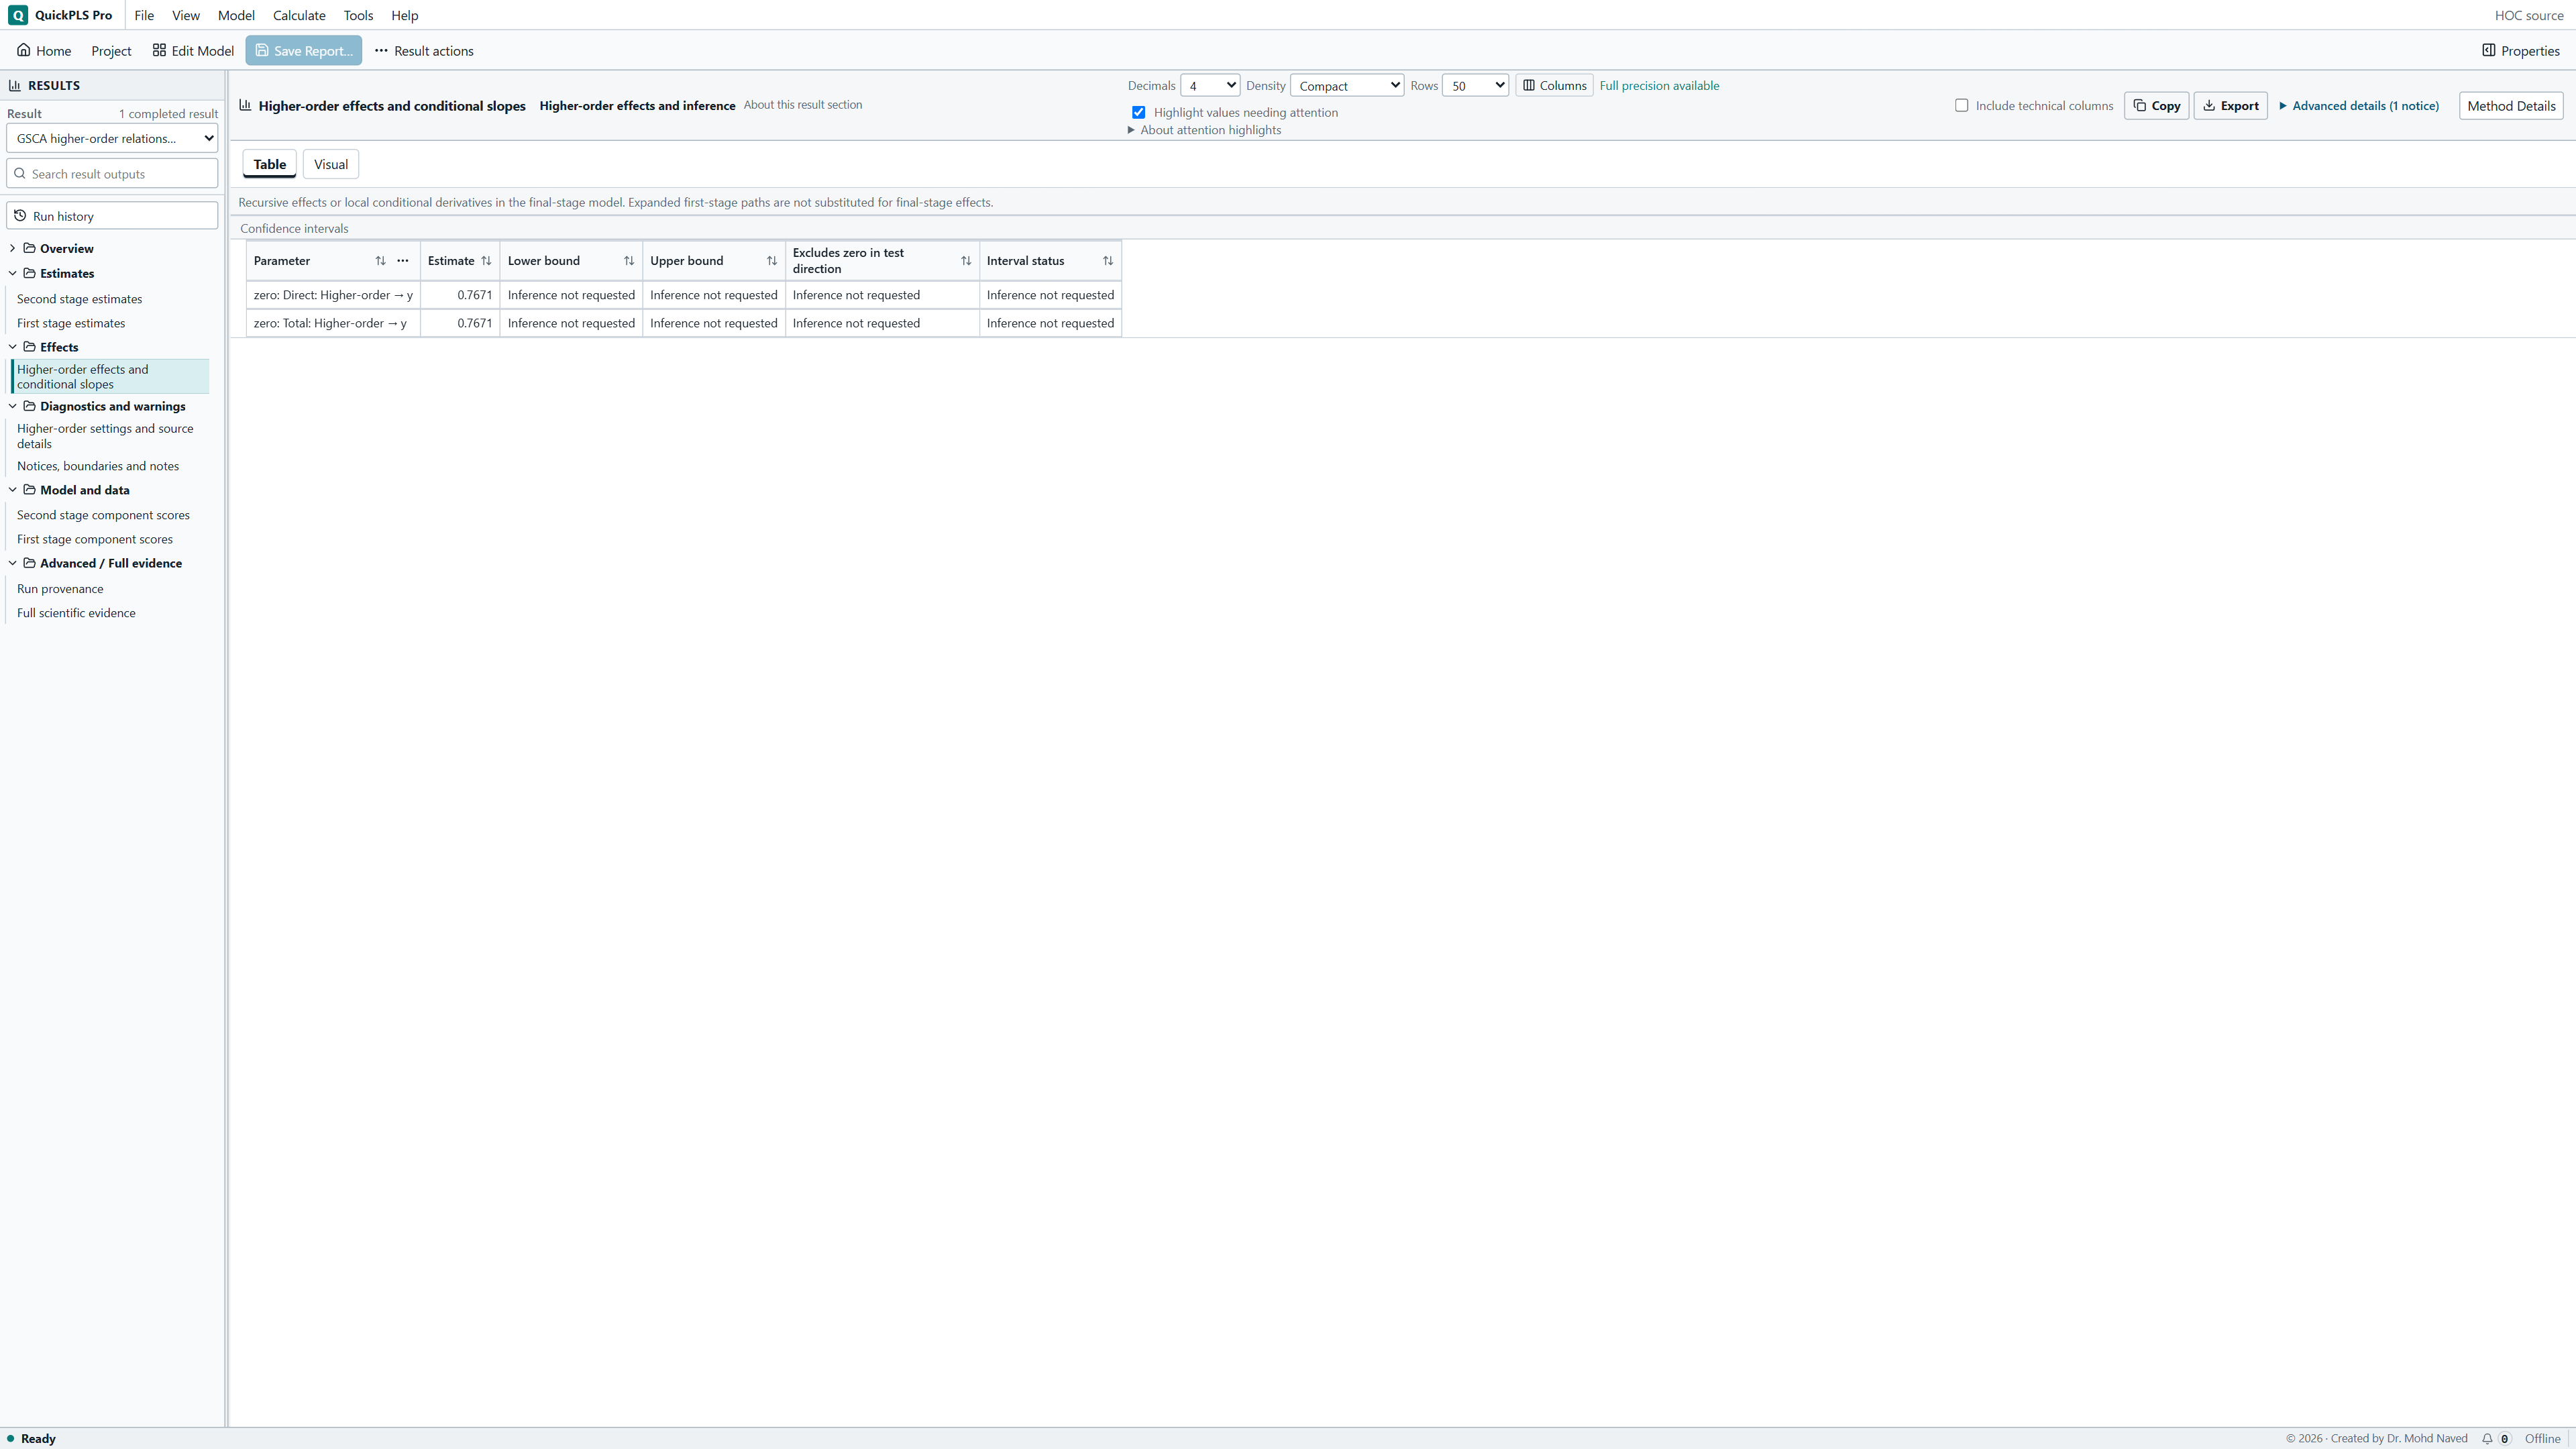
Explain the broader concept through its dimensions
Keep the dimension-level findings beside the higher-order result. A useful explanation says how the broader concept was formed and what its relationship with the outcome means. It should not conceal a poorly measured dimension behind one overall coefficient.
Illustrative example, not a software benchmark
Service quality might consist of reliability, responsiveness and assurance. A higher-order score needs to preserve the meaning of those dimensions. Removing a weak dimension solely to improve a numerical summary may change the concept from service quality as originally defined to a narrower construct.
Practice: build Readiness from three dimensions
Use research-workshop.csv. Create reflective Resources from resources_1 to resources_3, Support from support_1 to support_3, and Capability from capability_1 to capability_3. Create reflective Satisfaction from satisfaction_1 to satisfaction_3.
For this teaching model, Resources, Support and Capability form the higher-order Readiness construct, which predicts Satisfaction. Reflective dimensions mean that each dimension explains its own item responses. Formative Readiness means the dimensions contribute to the broader concept; they need not be interchangeable.
Save this higher-order model separately from the ordinary component exercise. The later numerical examples are hypothetical explanations of weights and paths, not checked answers from these data.
Build the hierarchy and inspect its stages
Create the lower-order blocks
Assign the listed items to Resources, Support, Capability and Satisfaction. Check that the item blocks and measurement directions match the intended concepts.
What you should see: The lower-order blocks have the intended indicators.
How to read it: Resolve overlapping or missing assignments before creating Readiness.
Add Readiness
Choose Model → Higher-Order Construct…. Name it Readiness. Select Resources, Support and Capability under Dimensions and choose Dimensions form the HOC. Under Advanced, set Construction approach to Disjoint two-stage. If Initial model path appears, set Direction to HOC → construct and Construct to Satisfaction. Click Create and retain Readiness → Satisfaction.
What you should see: Readiness has the stated component dimensions.
How to read it: Check that the hierarchy matches the proposed concept.
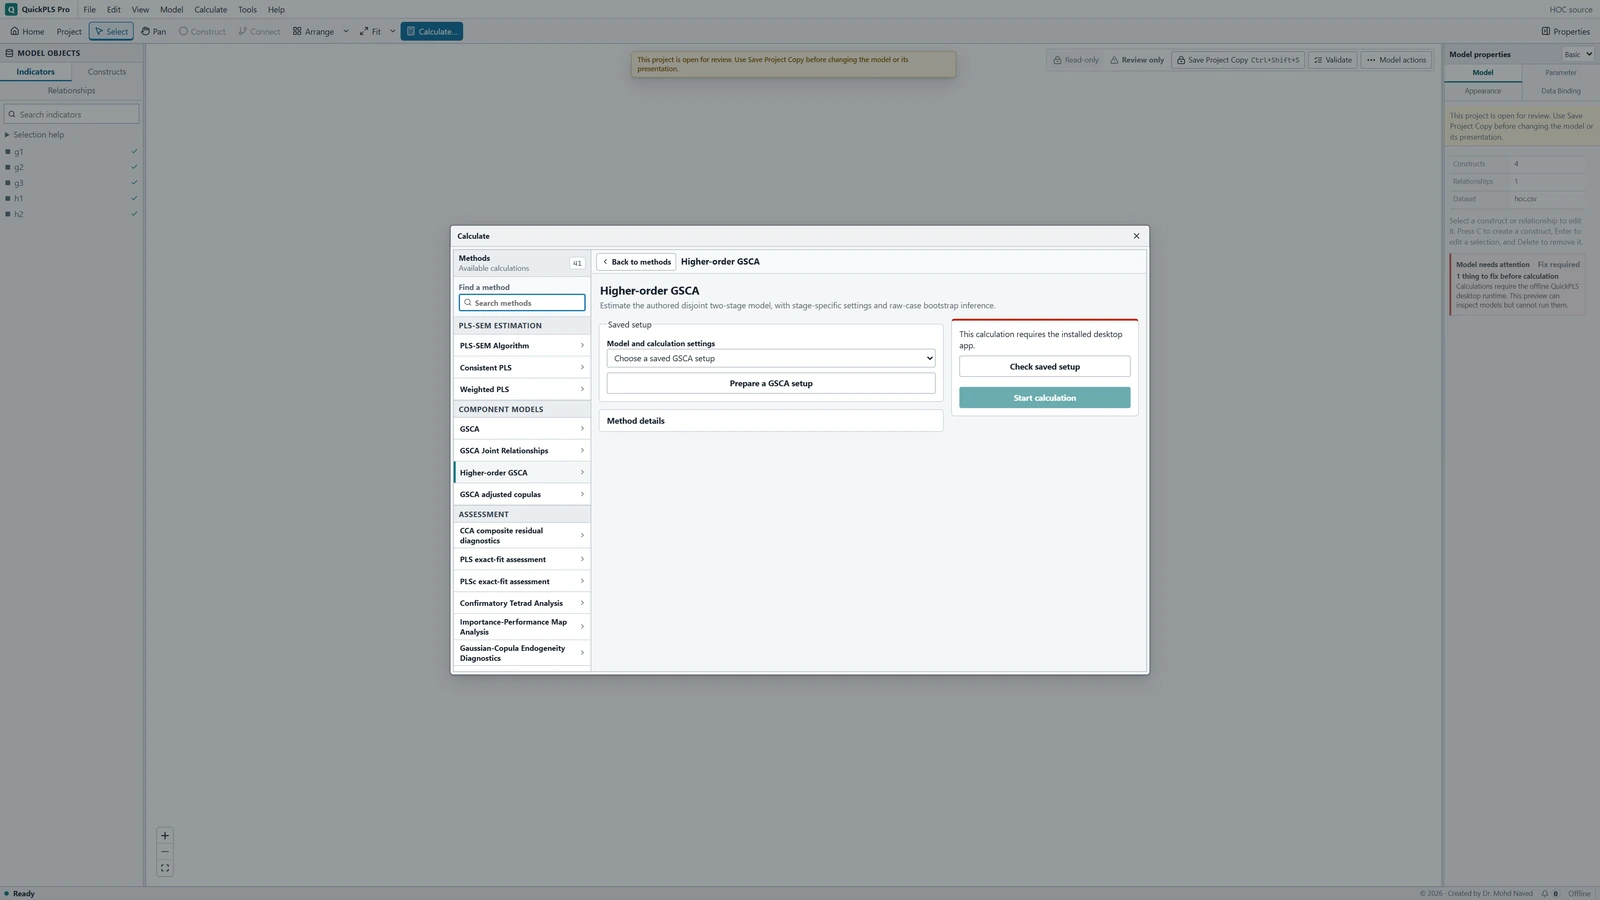
Higher-order GSCA settings in QuickPLS. Select your own dataset and model, then use the choices described in the steps. Prepare its GSCA setup
Save the model. Open Calculate… → Higher-order GSCA → Prepare a GSCA setup. Select the Saved higher-order model, enter a New setup name and click Preview setup.
What you should see: The GSCA setup names the saved higher-order model.
How to read it: Confirm that the intended hierarchy is selected.
Review the stage definitions
Check First stage: lower-order scores and Second stage: higher-order model. For this linear exercise leave Include joint products or quadratic relationships in this stage unchecked. Click Change stage settings if you need to edit the stage choices after the first preview.
What you should see: The stage definitions identify the lower-order scores used at the higher level.
How to read it: Check the direction and scale of those components.
Choose full two-stage uncertainty
Set the shared Interval method under Inference. For a bootstrap, record draws, Confidence level (%), Test alternative, Seed and Workers. Keep the first- and second-stage settings with the saved setup so the same procedure can be repeated.
What you should see: The selected uncertainty procedure repeats the stated stages.
How to read it: A point-only result does not supply intervals for the higher-order effect.
Save and read the completed analysis
Preview the final setup, Save new setup, Use saved setup, Check saved setup and Start calculation. Open Results. Check the common analyzed cases, both stages' convergence, the score-to-dimension mapping and the higher-order estimates before writing conclusions.
What you should see: The completed result separates component and structural outputs.
How to read it: Assess the lower-order blocks before interpreting the higher-order path.

Read a dimension weight without turning it into a percentage
The first stage estimates the lower-order scores from their indicator blocks. The second stage uses those scores to estimate Readiness and its relationship with Satisfaction. Check the saved mapping: a plausible coefficient cannot reveal that the wrong dimension score was used.
Suppose the hypothetical Readiness → Satisfaction coefficient is 0.40 and the Readiness dimension weights are Resources 0.50, Support 0.30 and Capability 0.20. The path describes the relationship on the reported scale. The weights describe how the specified dimensions contribute to the fitted component.
Weights are not percentage shares, and they need not sum to 100. A Resources weight of 0.50 does not establish that Resources is universally more important than Capability. Its interpretation depends on scaling, the other dimensions and the specified model.
On a small screen, swipe the table sideways to see every column.
| Output | Read it as | Check |
|---|---|---|
| First-stage weights and loadings | Measurement and scoring of each lower-order dimension | Original indicators, scale, orientation and complete cases. |
| Stage mapping | Which component score becomes which second-stage indicator | No dimension should be accidentally duplicated or omitted. |
| Second-stage weights or loadings | The higher-order measurement role actually specified | Formative contributions and reflective loadings are different quantities. |
| Higher-order structural paths | Relations involving the broader component | Read coefficients with second-stage scale and intervals. |
| Stage-specific refit diagnostics | Where resampling failed | A failed first stage is not a usable second-stage draw. |
| Published scores | Scores from a particular saved stage and result | Useful outputs, not a substitute for raw-case two-stage inference. |
Why the bootstrap must repeat both stages
The lower-order scores are estimates, not directly observed measurements. In a full two-stage bootstrap, cases are resampled, the first-stage model is fitted again, its scores are reconstructed, and the second-stage model is fitted from those new scores.
Both stages use the common complete-case sample needed for the raw variables involved. Check the retained-case count instead of assuming that each stage used all imported rows. If the first stage fails in a resample, there is no usable second-stage result for that draw.
Score directions and scales must be aligned across refits before comparing estimates. Read the usable and failed draw counts with the intervals. Running only a second-stage regression on a single exported set of scores leaves first-stage uncertainty out.
Fix the stage that caused the problem
Work from the first stage forward. If the final path looks implausible, check the dimension scores and their second-stage mapping before changing the final model. Use the table to distinguish a setup error from a substantively weak dimension.
On a small screen, swipe the table sideways to see every column.
| Symptom | Check | Reasonable action |
|---|---|---|
| A dimension is missing from stage two | The specified dimension structure and score mapping | Correct the mapping while keeping the intended theory explicit. |
| First-stage measurement is weak but the final path is strong | Indicator loadings, weights and dimension content | Discuss or revise the measurement argument before trusting the higher-order interpretation. |
| One formative weight is negative | Orientation, dimension overlap and conditional contributions | Inspect collinearity and substantive meaning; do not flip the sign just for presentation. |
| An interval is narrower after manual score export | Whether only the second stage was resampled | Refit both stages from raw cases when the interval is meant to describe uncertainty in the complete analysis. |
| Cases differ across stage summaries | Shared raw-variable requirements and missingness | Confirm that both stages use the same cases and explain exclusions before comparing their results. |
Check whether the hierarchy is doing useful work
Compare the planned higher-order model with a theoretically defensible dimension-level model. Ask whether the broad Readiness concept adds a useful explanation or merely conceals different dimension relationships.
Review collinearity among dimensions: closely overlapping scores can make weights unstable. A weak formative weight does not by itself justify deleting the dimension. Removing Resources, Support or Capability changes the meaning of Readiness.
If you try different starting weights, keep the model definition fixed and compare convergence and aligned results. Record changes to either stage. Do not choose a stage specification simply because it gives a more significant final path.
Describe the hierarchy before giving its coefficient
Methods example: Readiness was formed by Resources, Support and Capability. Their reflective indicator blocks were estimated in the first stage of a disjoint two-stage GSCA analysis. The resulting dimension scores entered the second-stage Readiness model, which predicted Satisfaction. We used the common complete-case sample and refitted both stages for uncertainty. Add the actual sample size, inference settings and convergence findings.
Results example: In the hypothetical illustration, Readiness → Satisfaction was 0.40. Explain its interval and practical size alongside the dimension results. Report the score mapping and any failures or instability so readers can assess the broader-construct finding. This coefficient is not a practice-data answer.
| Item | Report |
|---|---|
| Concept definition | Why the three dimensions form the higher-order construct |
| First stage | Indicator blocks, roles, weights, loadings and diagnostics |
| Second stage | Score mapping, higher-order role and relationships |
| Sample | Common raw-case count and omissions |
| Effects | Higher-order coefficients and matching intervals |
| Resampling | Both stages refitted; requested, usable and stage-failure counts |
Explain the full route from items to Readiness
- Draw the indicator blocks, the three dimensions, Readiness and Satisfaction.
- Explain why the dimensions form Readiness in this exercise.
- Identify the first-stage score used for each second-stage dimension.
- Explain why a dimension weight is not a percentage share or universal importance ranking.
- Describe what must be repeated in each bootstrap draw and why a failed first stage cannot supply a usable second-stage estimate.
Show readers how the two stages connect
- Name the higher-order construct and each lower-order dimension, with their measurement directions.
- Describe the disjoint two-stage approach and show which first-stage scores enter the second stage.
- Report the shared complete-case sample, dimension results and higher-order relationships.
- State whether resampling refitted both stages, and report failed fits, scaling and sign alignment.
Choose the hierarchy for a research reason
A higher-order construct is useful when the broader concept has a clear theoretical meaning. It is not a way to hide overlapping dimensions or weak items. A simpler model may answer the research question more directly.
This guide covers disjoint two-stage GSCA. Repeated-indicator and other constructions use different inputs and should not be described as the same procedure.
Keep the link between each stage score and the model that produced it. Replacing those scores with unrelated scores or arbitrary raw columns changes the analysis.