 QuickPLS
What the method does
A latent interaction can be represented by product indicators formed from the indicators of its constituent factors. The construction and centering rules are part of the measurement specification. The interaction estimate is interpreted alongside both lower-order factor effects and conditional slopes.
Product indicator: pᵢⱼ = xᵢmⱼ. Outcome equation: Y = b₁X + b₂M + b₃XM + ε.
xᵢ and mⱼ are indicators of X and M. Centering or residual-centering rules change how their products are constructed. The local X slope is b₁ + b₃M on the model scale; an interaction is not a third independent survey construct.
Data and analysis in QuickPLS
Use indicator-level data for two eligible factors and an outcome. Choose a defensible product construction and retain the lower-order factors in the model.
QuickPLS provides the product-indicator setup and interaction results. Check the generated products and model identification before reporting the conditional relationship.
Follow a worked example
The following example shows the data, settings and decisions for one analysis. Use the linked practice files to follow it. For your own study, keep the procedure and choose the variables, model and settings that fit your research question.
Download research-workshop.csv to begin. It contains 360 rows and 31 columns. The example below identifies the variables to use, their roles and any rows to exclude; not every column is an analysis variable.
Does the Quality-to-Satisfaction relationship depend on Trust?
Suppose Quality and Trust are both measured by several questions. You want to know whether the Quality-to-Satisfaction relationship changes with Trust. Because the moderator is a latent factor, it has no single observed column to multiply by Quality. Product-indicator moderation represents the interaction through products of the two factors' indicators.
QuickPLS constructs those products using the settings saved in the model. Centering, scaling and the included indicator pairs affect their meaning. The same construction is repeated when raw cases are resampled for the bootstrap, so the uncertainty belongs to the analysis you actually specified.
Conditional effects, also called simple slopes, translate the interaction into the Quality relationship at selected Trust values. Read them together with the main effects and factor scales. Other latent-interaction methods use different assumptions; this guide follows the product-indicator approach.
Prepare both parent factors and their main effects
Build the supported reflective factor model, with distinct indicator blocks and explicit marker indicators to set the factor scales. Include both parent main-effect paths into the outcome before adding the interaction. Decide how the indicators will be centered and scaled, and keep their direction consistent.
First save the model containing the authored Quality-by-Trust interaction. Then select that saved model in the product-indicator preparation screen. The preparation screen reads the construction already stored in the model; it does not create the interaction.
Create the interaction before preparing the calculation
Author the product-indicator interaction
In the model, open Model → Moderating Effect…; an existing general SEM model may label this Moderating Effect (Creates Model Revision)…. Choose the Relationship and Moderator, then set Construction to CB-SEM product indicators. Choose Centering and Source indicator scaling, then click Add moderating effect. Save the resulting model.
Prepare its analysis settings
Open Calculate… → CB-SEM Product-Indicator Moderation → Prepare a product-indicator setup. Select the Saved model, enter a New setup name and choose Product estimator. The centering and scaling choices belong to model authoring; this preparation screen reads them rather than editing them.
Choose uncertainty, preview and run
Set the Raw-case refit bootstrap and Conditional simple slopes options. Use Preview setup, Save new setup and Use saved setup. Check the saved choice under Model and calculation setup, click Check saved setup, then Start calculation. After Open Results, inspect construction before interpreting the interaction and slopes.
Check the products and scales, then interpret the effects
After Open Results, use Search result outputs to find Product-indicator construction and Construction and bootstrap settings for the unconstrained exercise. Check the source factors, products, centering, scaling, analysed rows and usable-refit counts.
Open Interaction and constituent effects. The constituent effects are the two parent main effects; read them alongside the interaction coefficient. Then open Conditional slopes for the predictor relationship at each latent moderator probe. Match every estimate and interval to its scale.
A bootstrap draw samples raw cases with replacement, so a case can appear more than once, and reconstructs the products before refitting. Failed fits remain part of the run's accounting. Do not interpret an unavailable interval as zero uncertainty, or combine a coefficient from one construction with an interval from another.
On a small screen, swipe the table sideways to see every column.
| Output | How to read it | What to check |
|---|---|---|
| Product construction diagnostics | The products and preprocessing defining the interaction. | Different constructions are different specifications. |
| Interaction / main effects | How the predictor's relationship with the outcome depends on the moderator in your factor model. | Read the interaction alongside the predictor and moderator main effects. |
| Raw-case bootstrap / simple slopes | Uncertainty after rebuilding the specified model on resampled cases. | Explain how the product indicators were constructed and report any failed model refits. |

Factor direction is part of the interpretation
Check the meaning of higher values and the marker indicator for each factor before comparing interaction signs. Use the same factor orientation and units in the coefficient table and conditional-effect plot.
Illustrative example, not a software benchmark
Reversing the orientation of a factor can reverse an associated interaction coefficient. The substantive relationship can remain equivalent once the interpretation is adjusted to the new orientation. Keep factor direction and scale consistent when comparing outputs or drawing a conditional-effect plot.
Practice: represent Quality × Trust with indicator products
Download research-workshop.csv below. Build Quality from quality_1 to quality_3, Trust from trust_1 to trust_3 and Satisfaction from satisfaction_1 to satisfaction_3. Treat each block as reflective. Draw Quality → Satisfaction and Trust → Satisfaction, then add the Quality-by-Trust interaction on Satisfaction.
Quality and Trust are exogenous common factors in this exercise: neither is predicted by another factor in this specification. Give them distinct, non-overlapping indicator blocks and appropriate marker identification. The marker provides the unit in which a factor's effects are expressed.
For the main exercise use unconstrained product indicators with double mean centering. Three Quality indicators paired with three Trust indicators create nine products. These are derived columns, not nine extra survey questions or independent observations. The synthetic data provide a practice setup; they do not establish that a latent interaction exists.
Build the products, then prepare their bootstrap
Check the model with both main effects
Create Quality, Trust and Satisfaction using their three matching indicators. For each block, open Properties → Inspector mode Expert → Parameter, choose Measurement model: Reflective and Scientific representation → Representation: Common factor. Set Marker indicator to quality_1, trust_1 or satisfaction_1 respectively. Retain both Quality → Satisfaction and Trust → Satisfaction, then save and review the measurement model. The selected construction needs distinct compatible source blocks; do not add unsupported cross-loadings or residual covariances.
What you should see: Both constituent factors have their main effects in the model.
How to read it: Keep them when adding the interaction.
Create the Quality-by-Trust interaction
Open Model → Moderating Effect… or Moderating Effect (Creates Model Revision)…. Set Relationship to Quality → Satisfaction and Moderator to Trust. Under Construction choose CB-SEM product indicators. Set Centering to Double-mean center. Use Original scale under Source indicator scaling for the raw-product arithmetic in this lesson, or record Sample standard deviation if deliberately investigating standardized constituents. All indicator pairs are included automatically. Click Add moderating effect and save the resulting model.
What you should see: The Quality-by-Trust term uses the intended indicator products.
How to read it: Check product construction and centering.
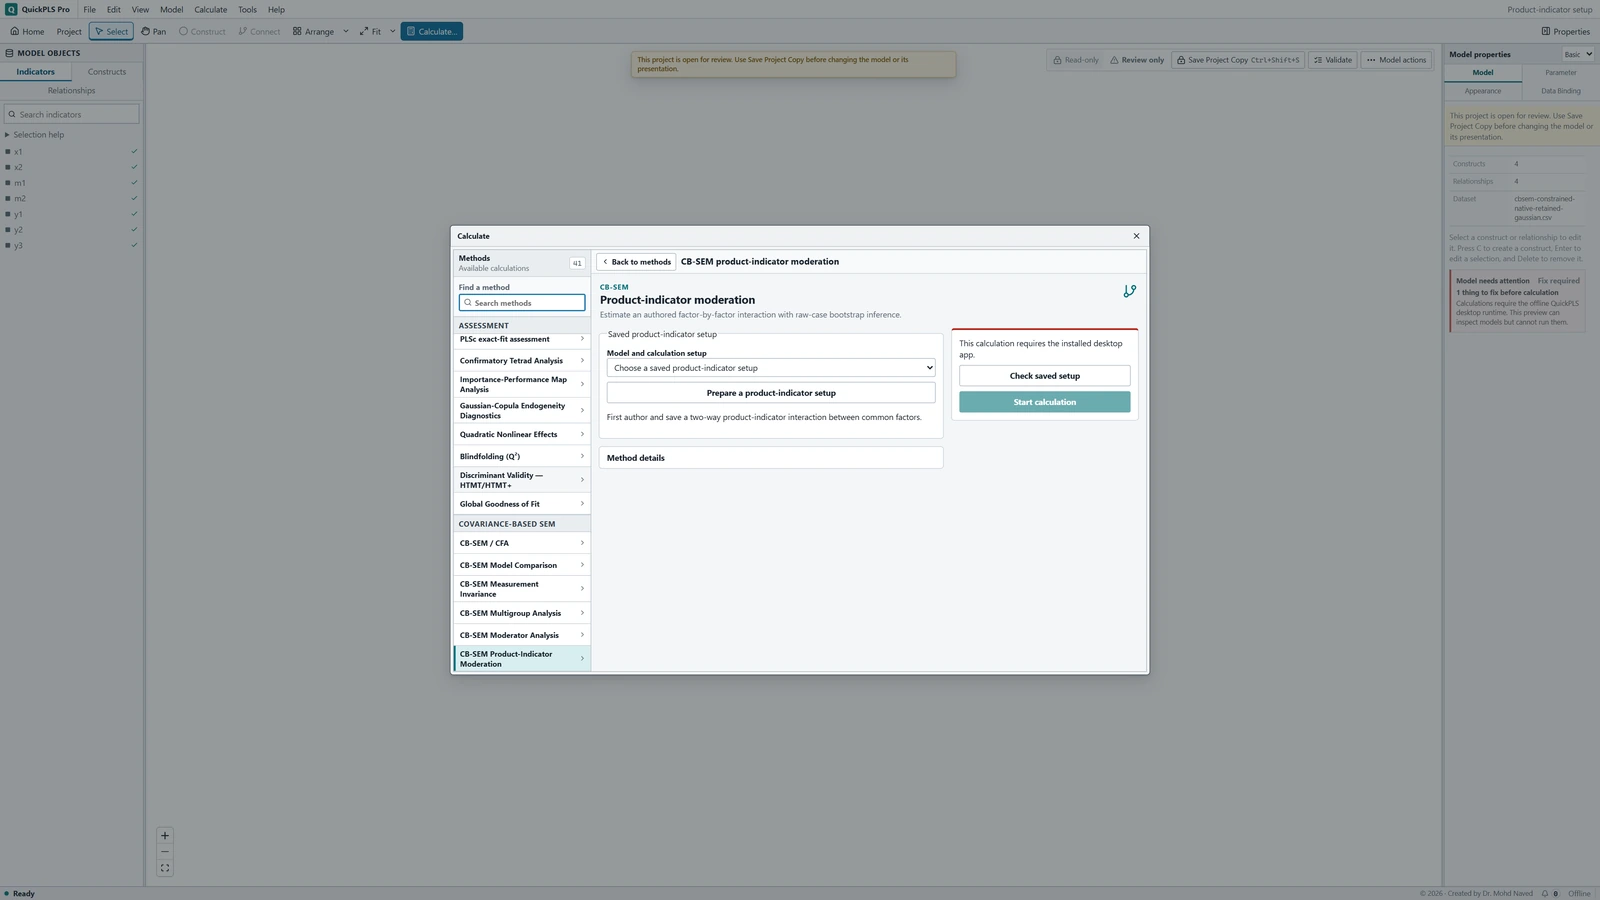
CB-SEM Product-Indicator Moderation settings in QuickPLS. Select your own dataset and model, then use the choices described in the steps. Prepare the saved product model
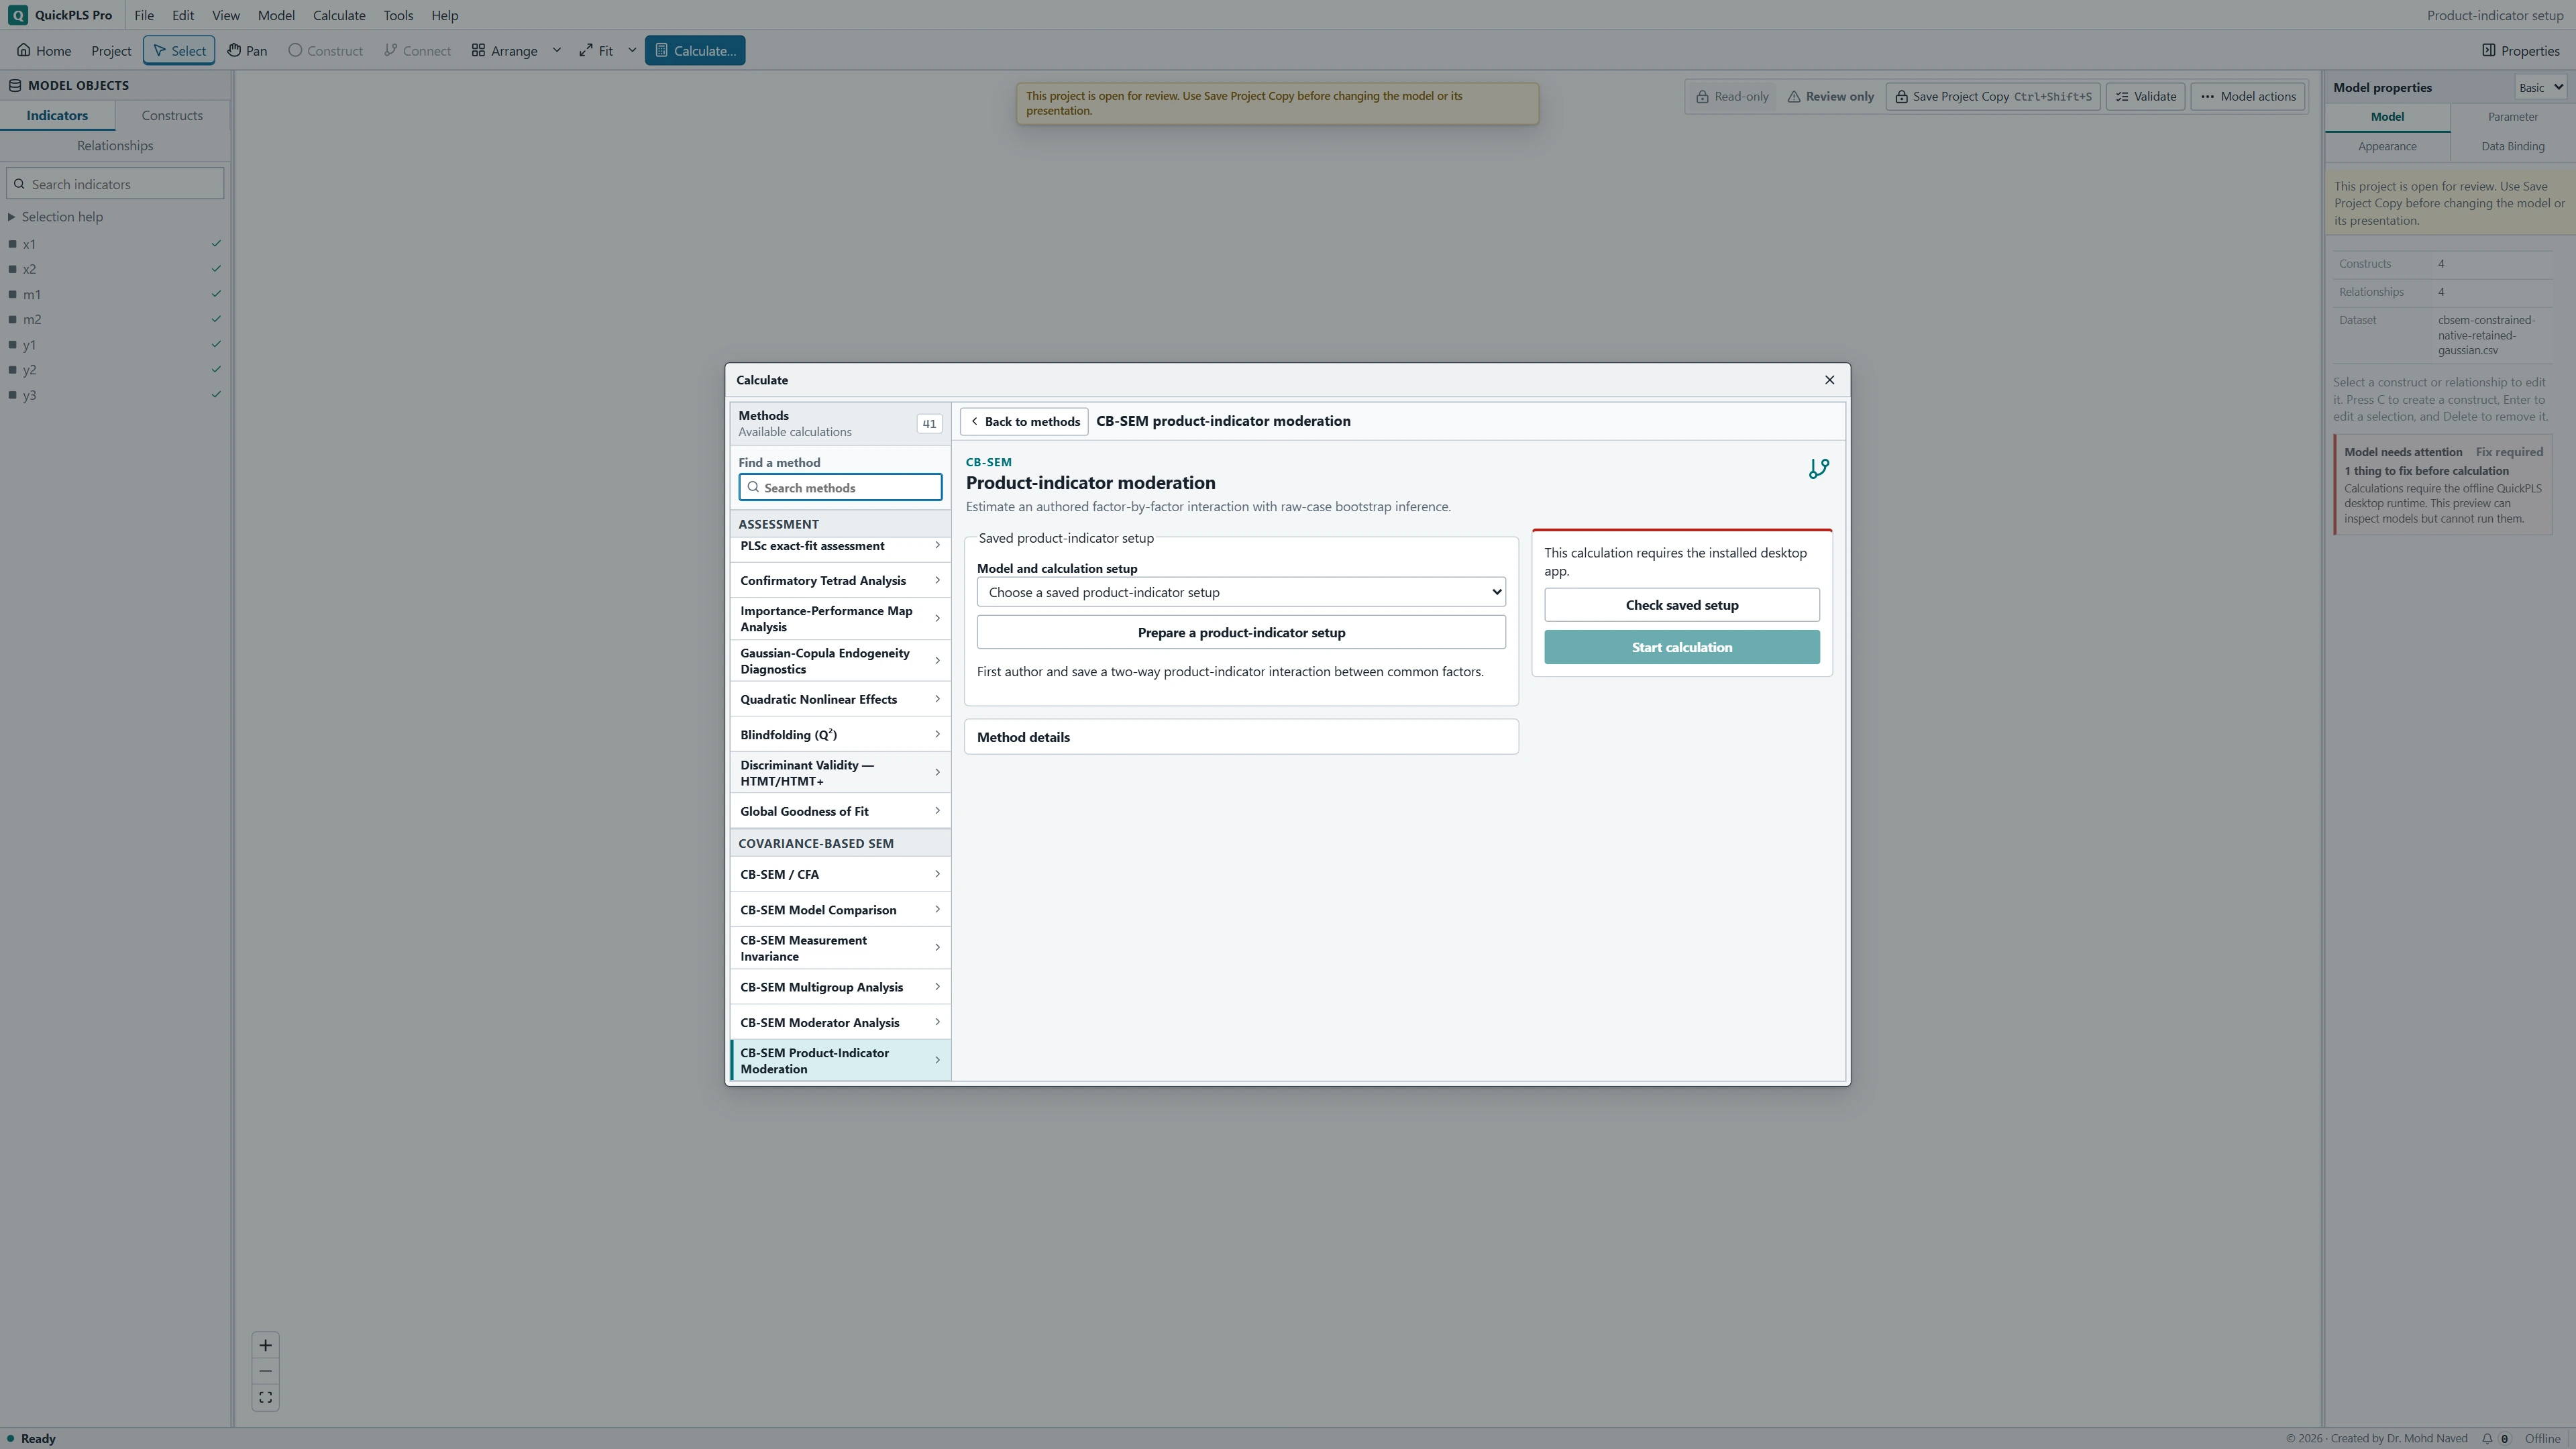
Choose Calculate… → CB-SEM Product-Indicator Moderation → Prepare a product-indicator setup. Select the Saved model and enter a New setup name. Under Product estimator choose Unconstrained product indicators. The saved model determines centering, source scaling and all-pairs construction.
What you should see: The saved product model is identified in the setup.
How to read it: Confirm it before running bootstrap inference.
Choose raw-case bootstrap settings
Under Raw-case refit bootstrap enter 1000 Bootstrap draws and 95 in Confidence level (%). Record Seed and Workers. Each draw samples raw cases and rebuilds the products using the same transformation. The teaching draw budget does not guarantee that enough fits will be usable for intervals.
What you should see: The raw-case resampling plan is recorded.
How to read it: Keep requested and usable draws with the final intervals.
Request slopes at latent Trust probes
Under Conditional simple slopes set Slope calculation to At moderator SD probes. Enter -1, 0, 1 in Moderator SD probes (comma-separated). These values mean one fitted latent Trust standard deviation below its centered origin, at the origin, and one above it. They are not raw Trust questionnaire scores.
What you should see: Slope probes are defined on the latent Trust scale.
How to read it: Their interpretation depends on the chosen reference and scaling.
Preview, save and calculate
Click Preview setup and inspect the product construction and eligibility checks. Click Save new setup, then Use saved setup. Check the selected saved analysis with Check saved setup and click Start calculation. After Open Results, review Product-indicator construction before Interaction and constituent effects and Conditional slopes.
What you should see: The completed result contains the interaction and requested slopes.
How to read it: A nonzero interaction should be explained through those conditional relationships.
Understand what centering and scaling change
Mean centering subtracts each source indicator's mean before multiplying indicator pairs. Double mean centering also subtracts the resulting product's mean. These choices define the origin used in interpreting the model. Standardizing the source indicators divides by their sample standard deviations and changes the product scale; it is more than a display preference.
The Product estimator menu also offers Residual-centered product indicators and Normal-theory constrained product indicators. Residual centering removes the product variation explained by its source indicators; the constrained alternative imposes additional normal-theory relationships. These are different models with additional assumptions. Choose one because it suits the study, not because its coefficient looks more favourable.
For centered factors with marker-defined scales and raw products, the simple slope is bX + bI × M. Here bX is the predictor main coefficient, bI the interaction coefficient and M the centered moderator value. With standardized source indicators, the interaction contribution also needs the recorded marker-scale divisor to return it to the appropriate factor units.
Use the slope output for the construction you fitted. The interaction factor's standard deviation is not a substitute for the moderator scale or the required divisor. A plausible-looking calculation can still describe the wrong units.
Read a slope as a change, not an outcome level
For hypothetical arithmetic, take a raw-product fit with bX = 0.30, bI = 0.20 and latent Trust standard deviation 1.5. At moderator SD probes -1, 0 and 1, the centered Trust values are -1.5, 0 and 1.5. The Quality slopes are therefore 0.00, 0.30 and 0.60.
Each slope describes the conditional change in Satisfaction per unit of Quality. It is a derivative, not an absolute predicted Satisfaction level or automatically a fully standardized coefficient. Read the matching interval before concluding that a relationship is clearly positive or negative. These numbers are teaching examples, not fitted CSV answers.
The probes are relative to each fit's latent moderator standard deviation. During bootstrapping, the refit's factor scale and rebuilt products define its slope. This differs from the observed-moderator lesson, where the original observed moderator values are held fixed. Do not describe these latent-SD intervals as estimates at fixed original raw Trust values.
On a small screen, swipe the table sideways to see every column.
| Output | Hypothetical example or check | Interpretation |
|---|---|---|
| Product construction | 3 by 3 source indicators = 9 products | Verify source blocks, pairing, centering and scales. |
| Parameter estimates | bX = 0.30; bI = 0.20 | Read the lower-order and interaction parameters together. |
| Simple slopes | 0.00, 0.30, 0.60 at SD probes -1, 0, 1 | Changes in the outcome per unit of the predictor on the reported marker scale; these are not fully standardized beta values. |
| Bootstrap summary | 1000 requested; enter actual usable count | Raw indicators and their products are rebuilt within each fit. |
| Convergence and variances | Inspect any failed or improper fit | A constructed interaction does not guarantee an identified usable model. |
Check product construction and refit stability
Start with the two source indicator blocks, marker scaling and retained main effects. Then inspect the construction diagnostics and check the fitted model for problems such as negative residual variances or failed convergence. Highly related products or unusual combinations of indicator values can make the expanded model unstable; investigate those problems before altering the model.
The bootstrap requires at least 1000 usable fits and at least 90% of the planned draws for intervals. With 1000 requested in this exercise, any failure prevents that threshold being reached. Review the failed fits and their reasons before planning a larger run. More draws cannot correct an invalid measurement model.
On a small screen, swipe the table sideways to see every column.
| Symptom | Check | Reasonable action |
|---|---|---|
| The setup rejects the indicator blocks | Overlapping indicators, cross-loadings or source-block residual covariances | Check whether a supported measurement specification fits your theory. If it does not, report the limitation rather than omitting a required relationship. |
| Products or coefficients have unexpectedly large magnitudes | Indicator units, constituent standardization and marker scales | Interpret on the recorded scale; compare equivalent derivatives rather than raw coefficients across transformations. |
| Simple slopes are unavailable | Centered origin and the chosen product approach | Use an eligible construction or report why slope interpretation is unavailable. |
| The interaction seems strong but unstable | Product collinearity, improper variances and failed refits | Inspect the full measurement model and uncertainty before drawing a moderation conclusion. |
| The plot is described as absolute predicted satisfaction | Whether the output contains derivatives or identified intercepts | Label conditional slopes accurately; do not invent an outcome intercept. |
Compare a justified alternative without chasing significance
One useful sensitivity exercise compares raw and standardized source-indicator products while retaining the same factor definitions and analysed cases. Explain the changed units and compare slopes at equivalent factor values. Different numerical interaction coefficients can describe similar relationships after the correct scale conversion.
Products can magnify unusual combinations of source indicator values. Review influential observations for data errors and substantive plausibility. Keep valid cases unless a stated study rule justifies exclusion; removing them because they weaken the interaction would change the sample to suit the desired result.
Keep the Trust main effect even when its individual estimate is not statistically significant. It contributes to the meaning of the interaction model. If you change estimator after reading the results, report that choice as exploratory and show how it affected the conclusion.
Report the construction, probes and uncertainty
Methods example: We represented Quality × Trust using unconstrained Cartesian all-pairs product indicators. Each source factor had three distinct reflective indicators and marker identification. We used double mean centering and reported whether the source indicators were standardized. Raw-case bootstrap refits reconstructed the products. We evaluated slopes at -1, 0 and 1 fitted latent Trust standard deviations.
Results example, using hypothetical values: On the centered raw-product scale, the Quality coefficient was 0.30 and the interaction coefficient was 0.20. With latent Trust standard deviation 1.5, the conditional Quality slopes were 0.00, 0.30 and 0.60. Replace these illustrative values with the saved output, and add the effect-specific intervals and usable-refit counts before interpreting precision.
| Item | Example entry |
|---|---|
| Source factors | Quality and Trust; three indicators each |
| Construction | Nine Cartesian products; double mean centered |
| Estimator | Unconstrained product indicators |
| Scaling | State raw or standardized constituents and markers |
| Conditional estimates | 0.00, 0.30, 0.60 at SD probes -1, 0, 1, hypothetical |
| Uncertainty | 95% matching intervals; requested, usable and failed raw-case refits |
Explain the factor-by-factor result from construction to conclusion
- List all nine indicator products and identify the Quality and Trust indicators used in each.
- Record both parent main effects, the product estimator, centering and source scaling.
- Explain why a latent standard-deviation probe differs from a raw observed moderator value.
- Check the recorded scale divisor before recalculating a conditional slope by hand.
- Describe each slope as a change in the outcome per unit of the predictor, rather than an absolute outcome prediction.
- Give a substantive reason for the chosen product estimator and explain what the uncertainty allows you to conclude.
Make the product construction reproducible
- Describe the predictor, moderator and outcome factors, their indicator blocks, marker indicators and parent main-effect paths.
- Name the product estimator, included pairs, centering, source-indicator scaling and factor orientation.
- Give the conditional slopes where selected, their moderator probes and scale. Report the matching raw-case bootstrap settings, intervals and usable and failed refit counts.
Name the construction you actually fitted
Changing centering, source-indicator scaling or the product estimator changes the specified analysis. Record those choices when comparing results. Product-indicator estimates should not be presented as results from every latent-interaction method, including likelihood-based alternatives.