 QuickPLS
Write down what each column means
Make a short list of your columns and their meanings. For each one, record what was measured, its unit or response scale, the values allowed, and how a missing answer is recorded. This list is often called a data dictionary. It will help you assign the right columns in QuickPLS and describe the study later.
Separate survey questions from identifiers, group labels, dates and case weights. A respondent number is a label, not a measure. Department codes 1, 2 and 3 name groups; they do not mean that one department has more of something than another.
Check negatively worded survey questions. If a high response means the opposite of the other questions, it may need reverse coding according to the scale's instructions. Keep a record of the rule and check the result. A negative loading is a reason to investigate the wording and coding, not an automatic reason to delete the question.
Check the imported table before using it
Importing a file successfully does not establish that its rows and variables have been read correctly. Compare the preview and imported table with the original records before analysing them.
Look for repeated column names, extra headings, blank trailing rows, values outside the response scale, and words in columns that should contain numbers. A spreadsheet can display something that looks numeric while storing it as text.
Use the screenshot to recognise the imported-data area. It shows a small teaching file, so its row count is not a target for your study.
Open the import preview
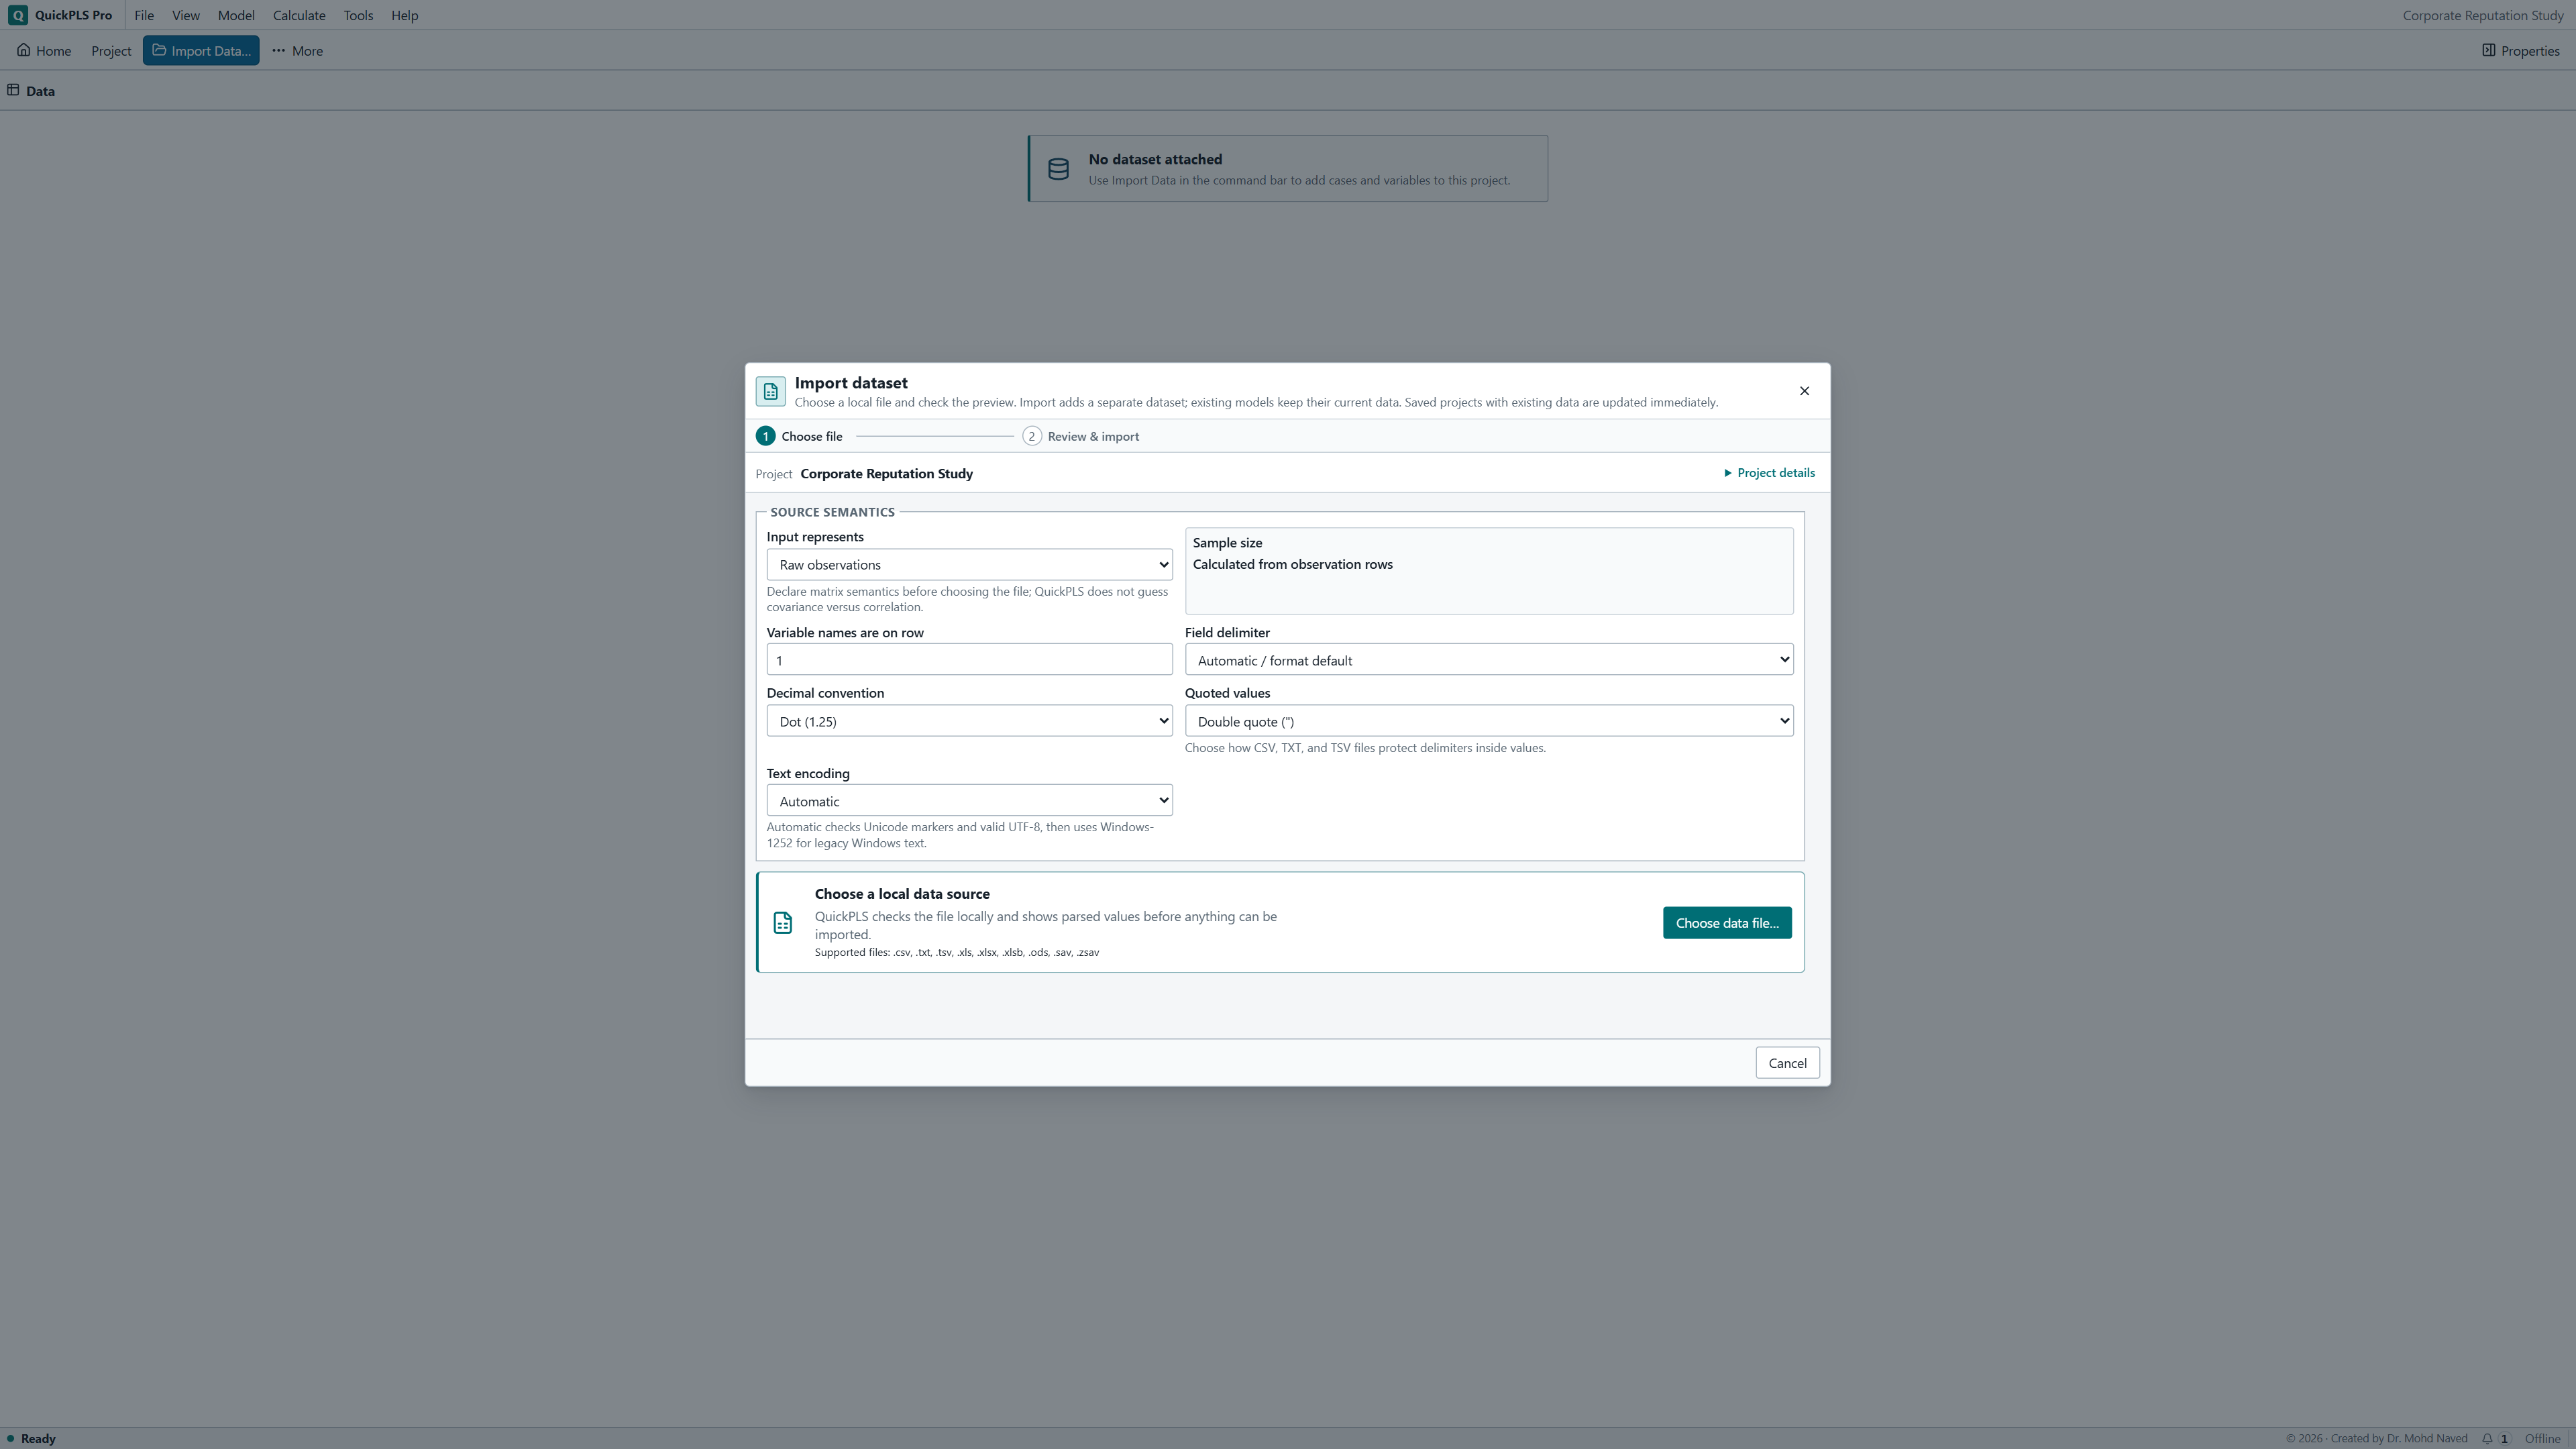
In a writable project, choose File → Import Data… (Ctrl+I), then Choose data file… and select the file. Review & import displays the import settings and preview.
Check how the file is read
Check Input represents, Header row, the column separator and Decimal convention against the file you are importing. Each expected variable should occupy its own column. Verify numeric values against the original, including decimal places and negative signs.
Check rows and variable roles
Confirm that each row represents the intended unit, such as one respondent. Compare the row count and column names with your records. Use the data dictionary to distinguish measurements from identifiers and group codes; a numeric code is not automatically a continuous measurement.
Import and inspect
Click Import dataset. After Dataset imported and verified, check the imported table again. Resolve unexpected rows, blank entries or changed values before building a model. Keep a note of any correction and the record that supports it.
View the setup screen
Decide what a missing answer should mean
First identify your missing-value codes. An empty cell, a special code and a genuine zero are different things. Do not let a code for 'no answer' enter the calculation as if someone had given that numerical response.
One approach is to use only rows with answers for every variable required by the model. This is called complete-case analysis, or listwise deletion. It can reduce the sample and change which kinds of respondents are represented. Another approach fills a missing value with an average. Mean replacement also changes the data and is not automatically suitable because it keeps more rows.
Choose among the options supported by your method based on why the answers are missing and the study design. Keep a record of the choice. For models with interactions, also check whether missing values are handled before the new columns are created. For prediction, preparation must use the training cases rather than information from the cases reserved for testing.
Check the input required by your chosen method
A method expects a particular kind of input. Binary logistic regression needs the declared 0/1 outcome. For example, the coding must make clear which value means the event occurred. A category label or an identifier cannot be used as a continuous measure simply because it contains digits.
For fsQCA, a membership value between zero and one describes how strongly a case belongs to a defined set, such as 'high capability'. Converting raw scores to that scale needs a reasoned rule, called calibration. Dividing every score by the largest possible score does not by itself explain what high capability means.
A covariance matrix is a summary of how variables vary together. If you use one, keep the variable order, sample size and calculation convention with it. The matrix does not contain individual respondents, so it cannot supply rows for a case bootstrap.
If QuickPLS rejects an input, use the message to find the mismatch. Correct the data or select a method that suits the research question and available information.
Keep the original file and a record of your changes
Save an untouched copy of the original data. Work on a separate copy and record any recoding, corrections or excluded rows. Give each changed file a clear name so that you can connect a result to the data used for it.
When an estimate changes, you should be able to tell whether you changed the model, the sample or the data preparation. This record is also useful when a co-author or reviewer asks how you reached the final sample.
- Confirm the meaning, unit and allowed values of every variable used.
- Investigate missing answers and unusual values against the original records.
- Record the number of cases imported and the number actually analysed.
- Keep calculated columns clearly named and distinguishable from the original responses.